1. What is CPR cloud?

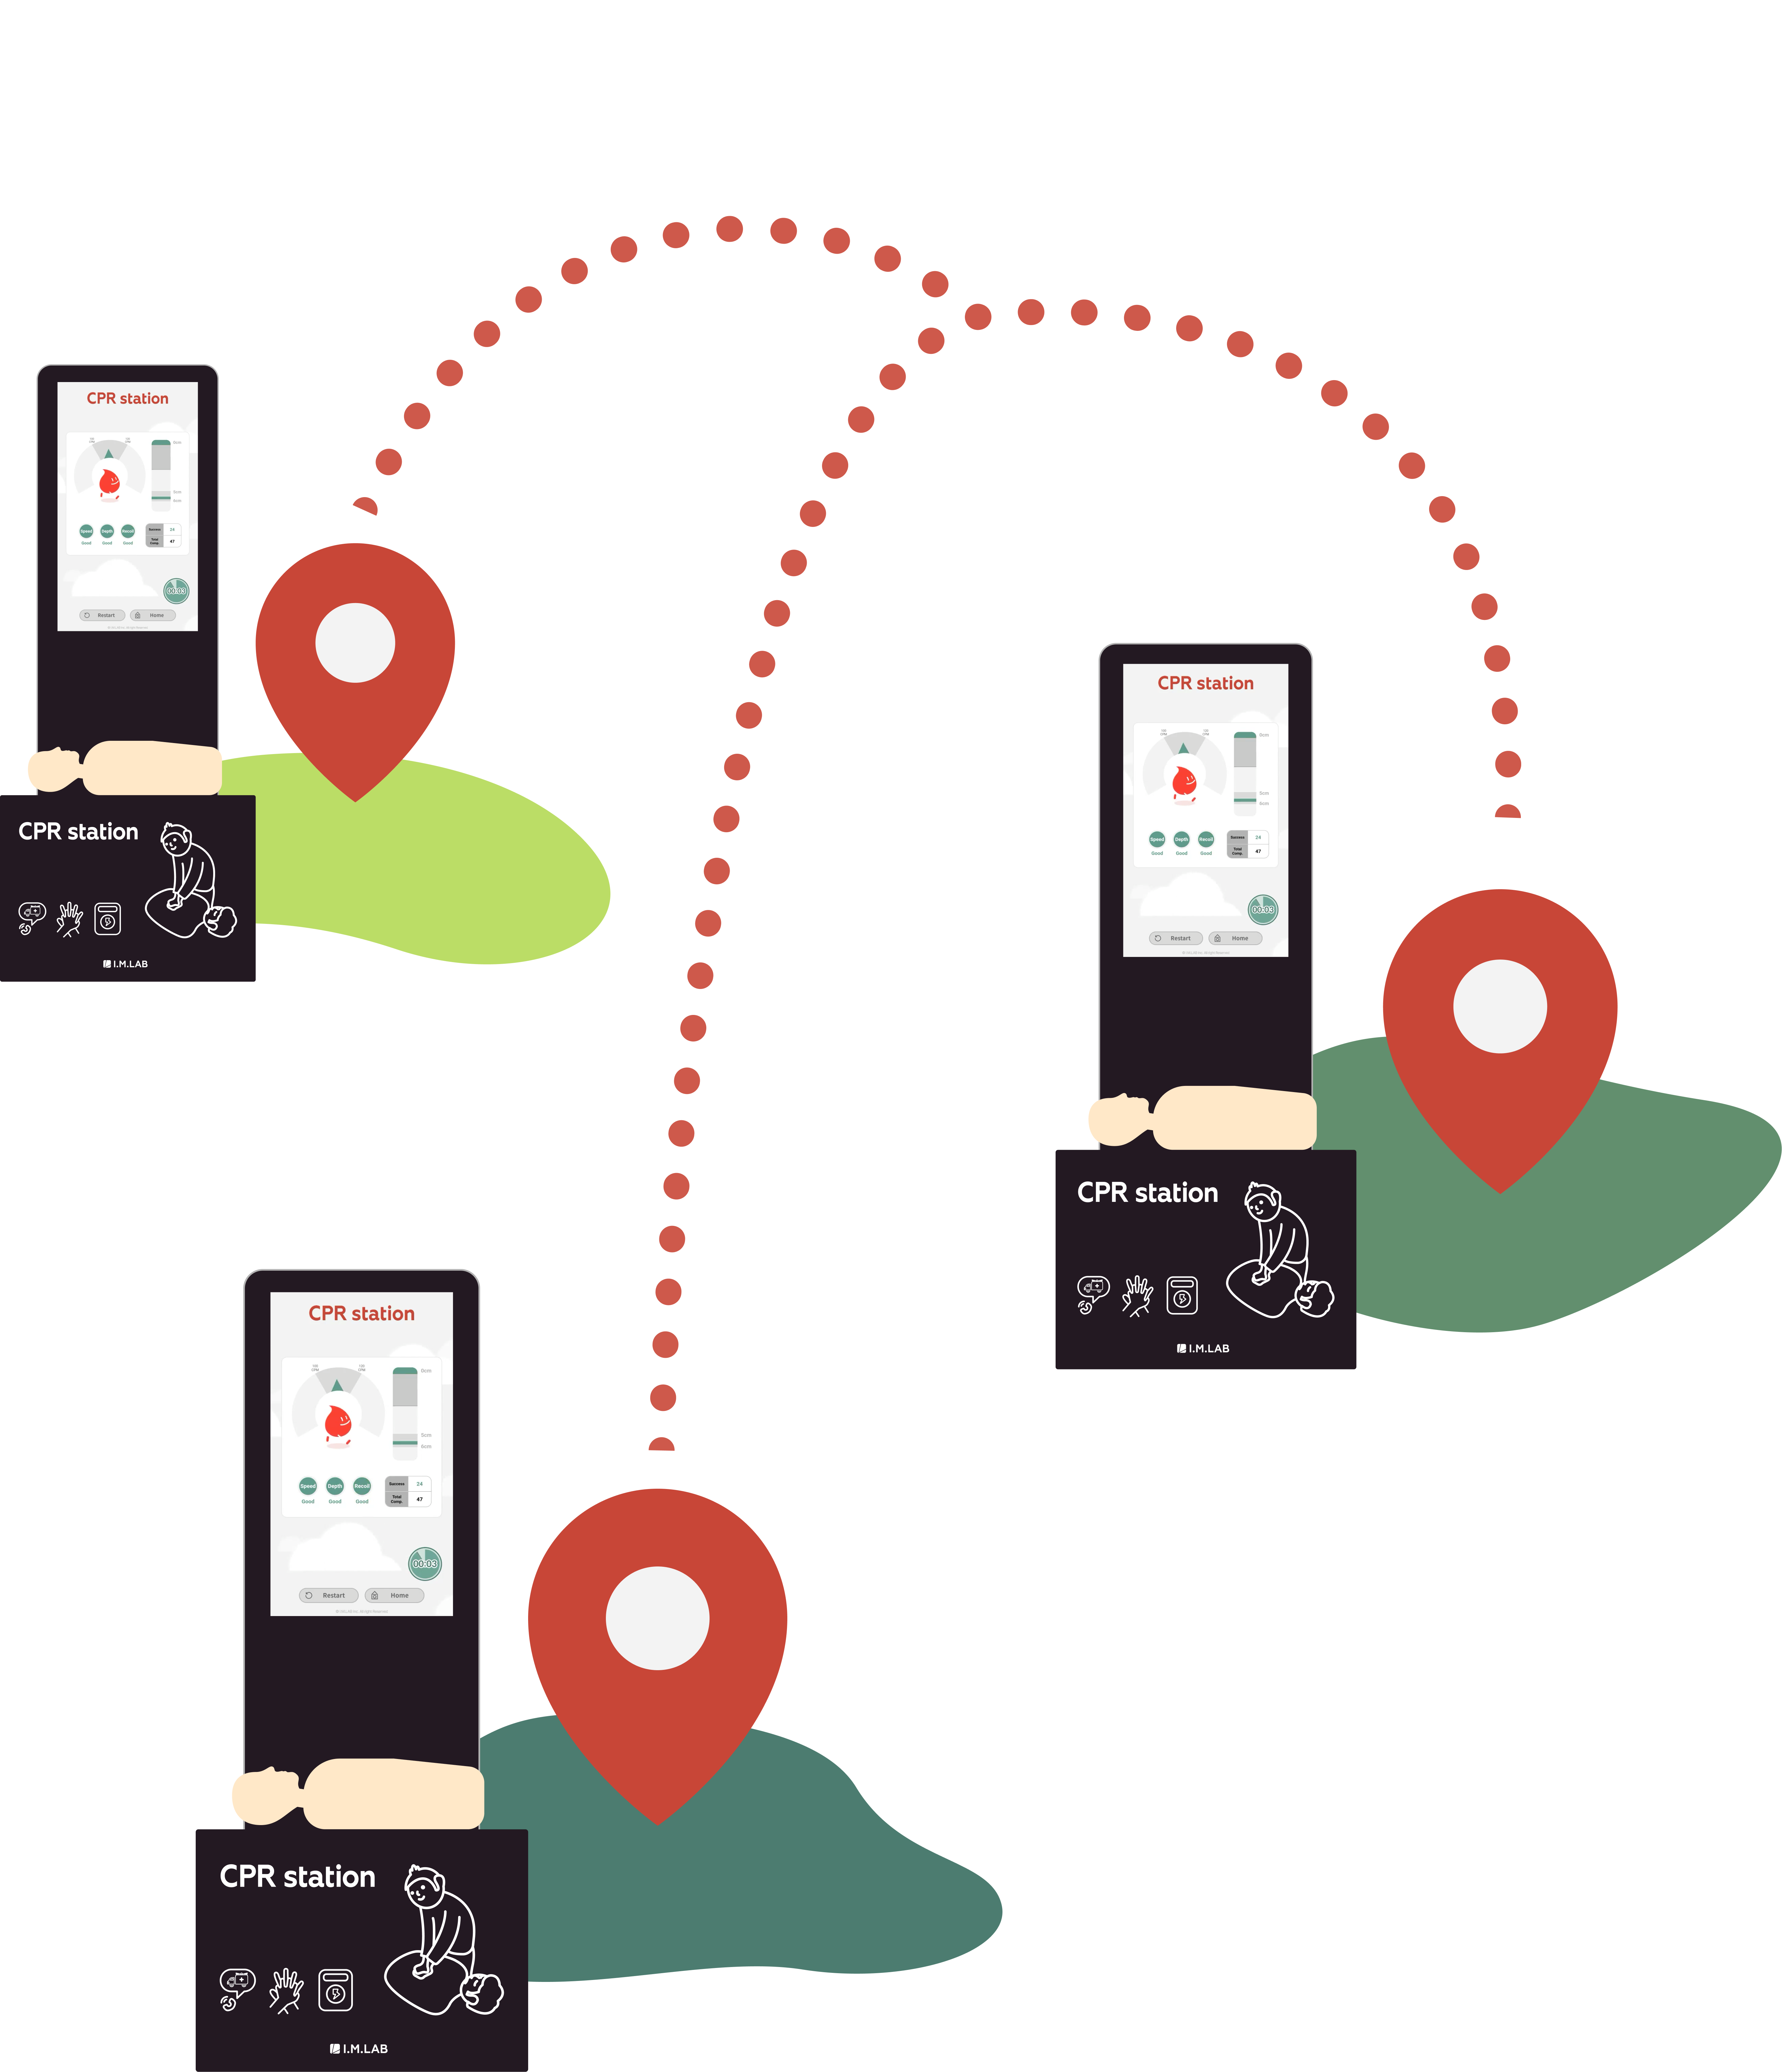
CPR Cloud is a repository and dashboard service that integrates with I.M.LAB services such as CPR Station to monitor product status and view performance indicators at a glance in real time.
Real-time status monitoring
You can check the status of CPR Station devices at a glance in CPR Cloud without visiting the site in person.
CPR results and performance management You can review the accumulated results of CPR Station users as statistical data or as raw data.
2. Issuing an account
When you purchase a CPR Station product or service, you will receive a management code that allows you to manage all your owned devices at once. You can log in to CPR Cloud using the management code and the initial password.
- The management code is separate from the activation/license code.
- If you have not received your management code, please contact us at contact@imlabworld.com with your organization name, contact person, and purchase date.
3. Page layout of the web app
CPR Cloud pages basically consist of a menubar, a header, and content. The screen is adjusted and displayed according to each resolution, so on lower resolutions you can open the menubar by selecting the menu icon (☰).
Menubar : You can switch services by selecting the current product, or choose the menu you want. You can change the language by selecting the language button at the bottom.
Header (My info) : Displays the information of the logged-in account. Click to log out.
Content area: Displays the contents for the selected menu.
4. Key features
4.1. Dashboard
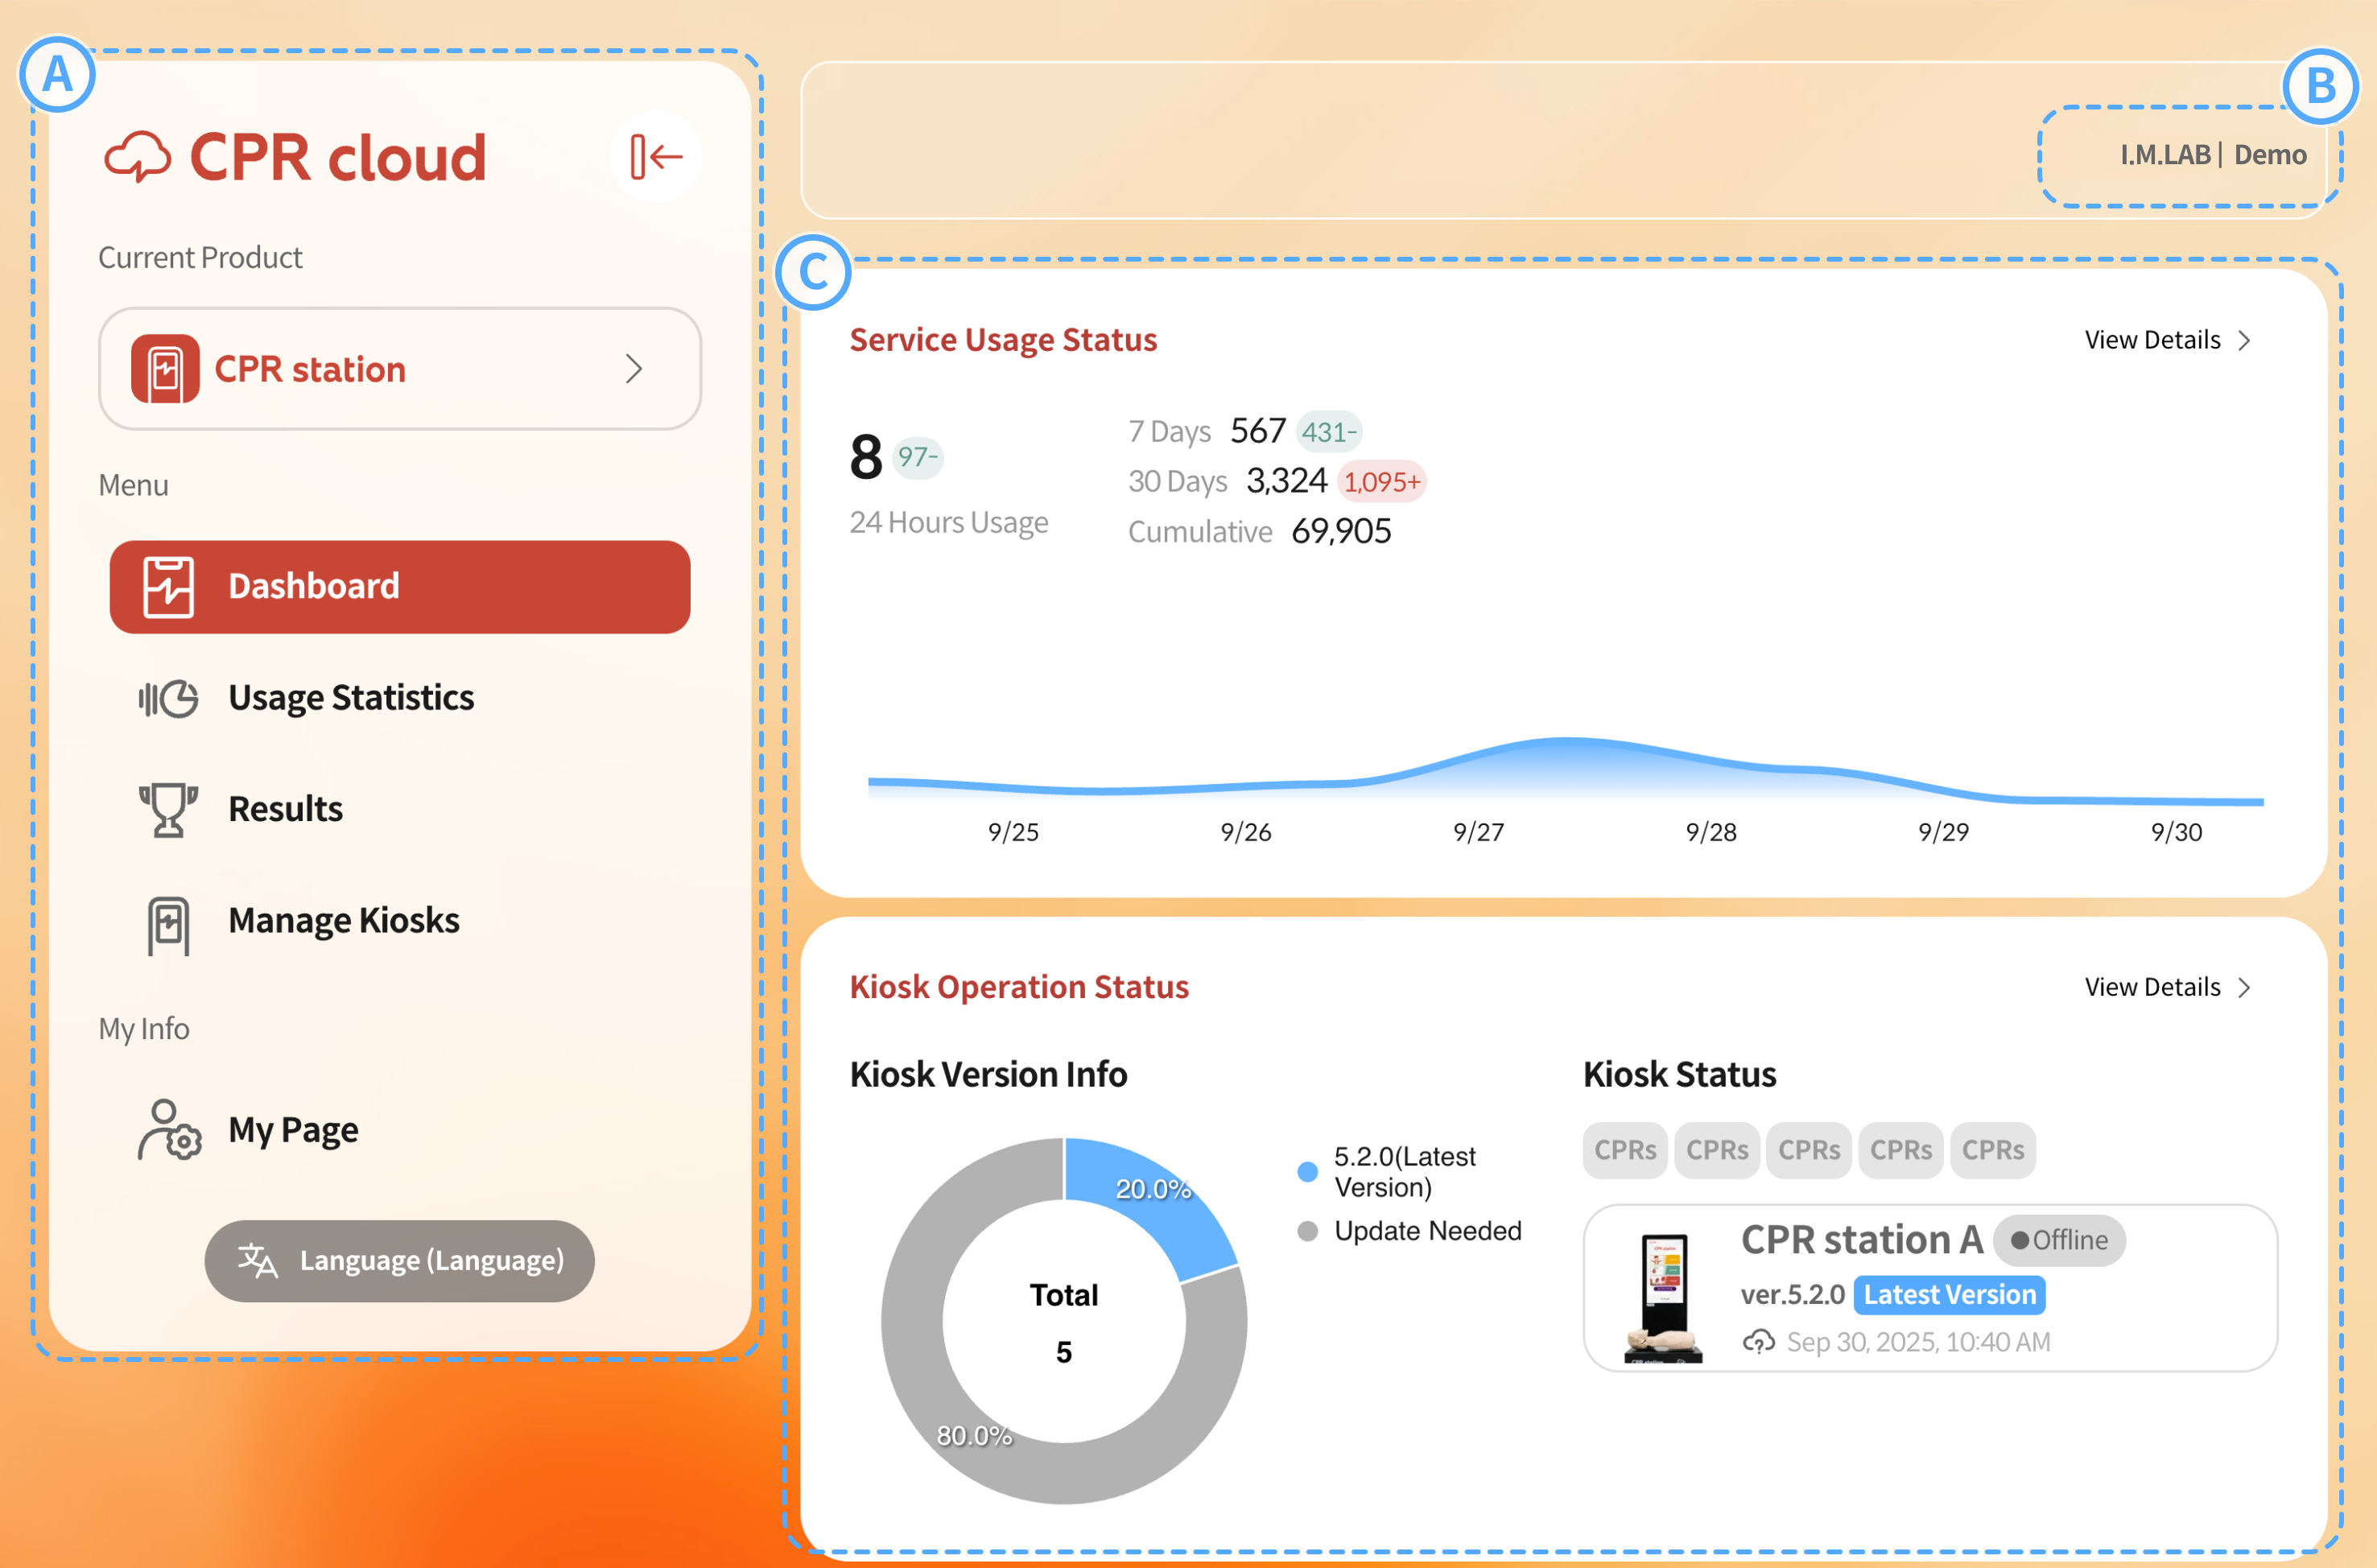
The dashboard is the home screen of CPR Cloud, designed to give you an at-a-glance overview of device usage and status. Selecting View Details in each section takes you to the corresponding menu.

Usage Statistics : Displays the usage of all CPR Station devices you own. You can view real-time data for the last 24 hours, 7 days, 30 days, and total cumulative usage.
A-1. The real-time usage trend is shown as a graph. The time range is automatically adjusted for easier visualization of usage patterns.
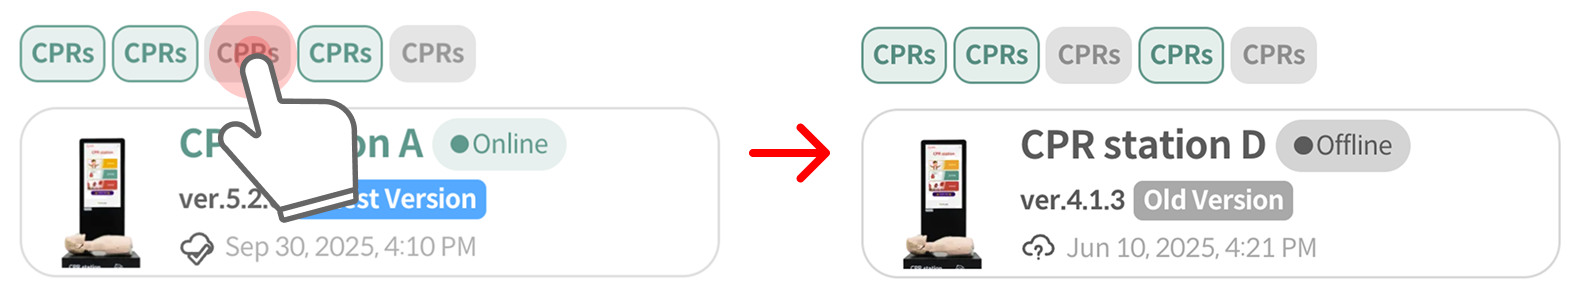
Kiosk Status : Briefly shows the current status of each kiosk. In the kiosk version information, you can check how many operating kiosks require updates.
B-1. Each kiosk chip displays its status by color:Greenindicates normal operation (online),Yellowindicates attention required, andGrayindicates offline. Hovering over or selecting a chip shows detailed status information for that kiosk.
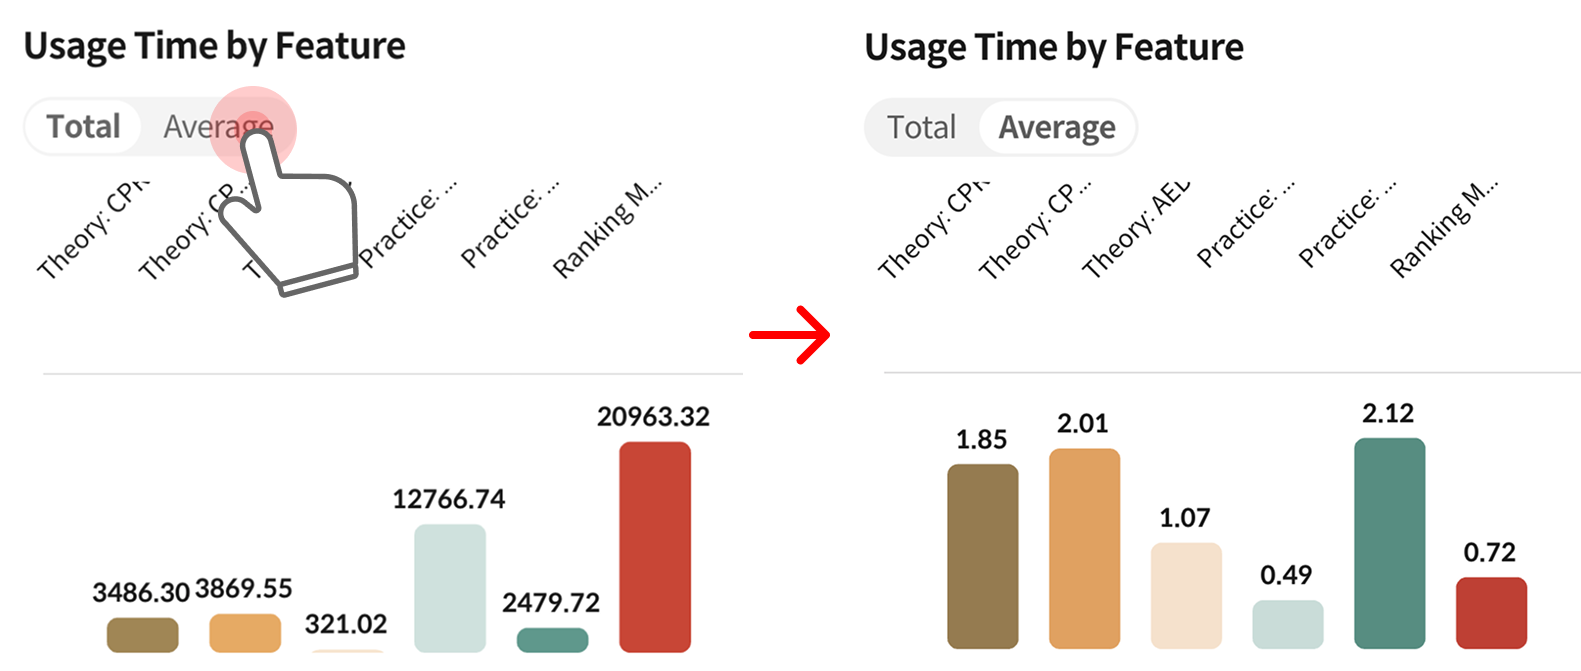
Frequently Used Features : Displays the usage statistics of frequently used functions.
C-1. You can check the usage time for each feature. Switch between segments to view both cumulative and average times.
Usage Overview : A section for reviewing accumulated data.
D-1. Recent Usage Records : Displays information about the most recent records.D-2. High Score: Shows the top 5 rankings achieved in Ranking Mode within the last year.
4.2. Usage Statistics
The Usage Statistics feature allows you to review the usage history of functions categorized by various criteria.
4.2.1. Feature Statistics
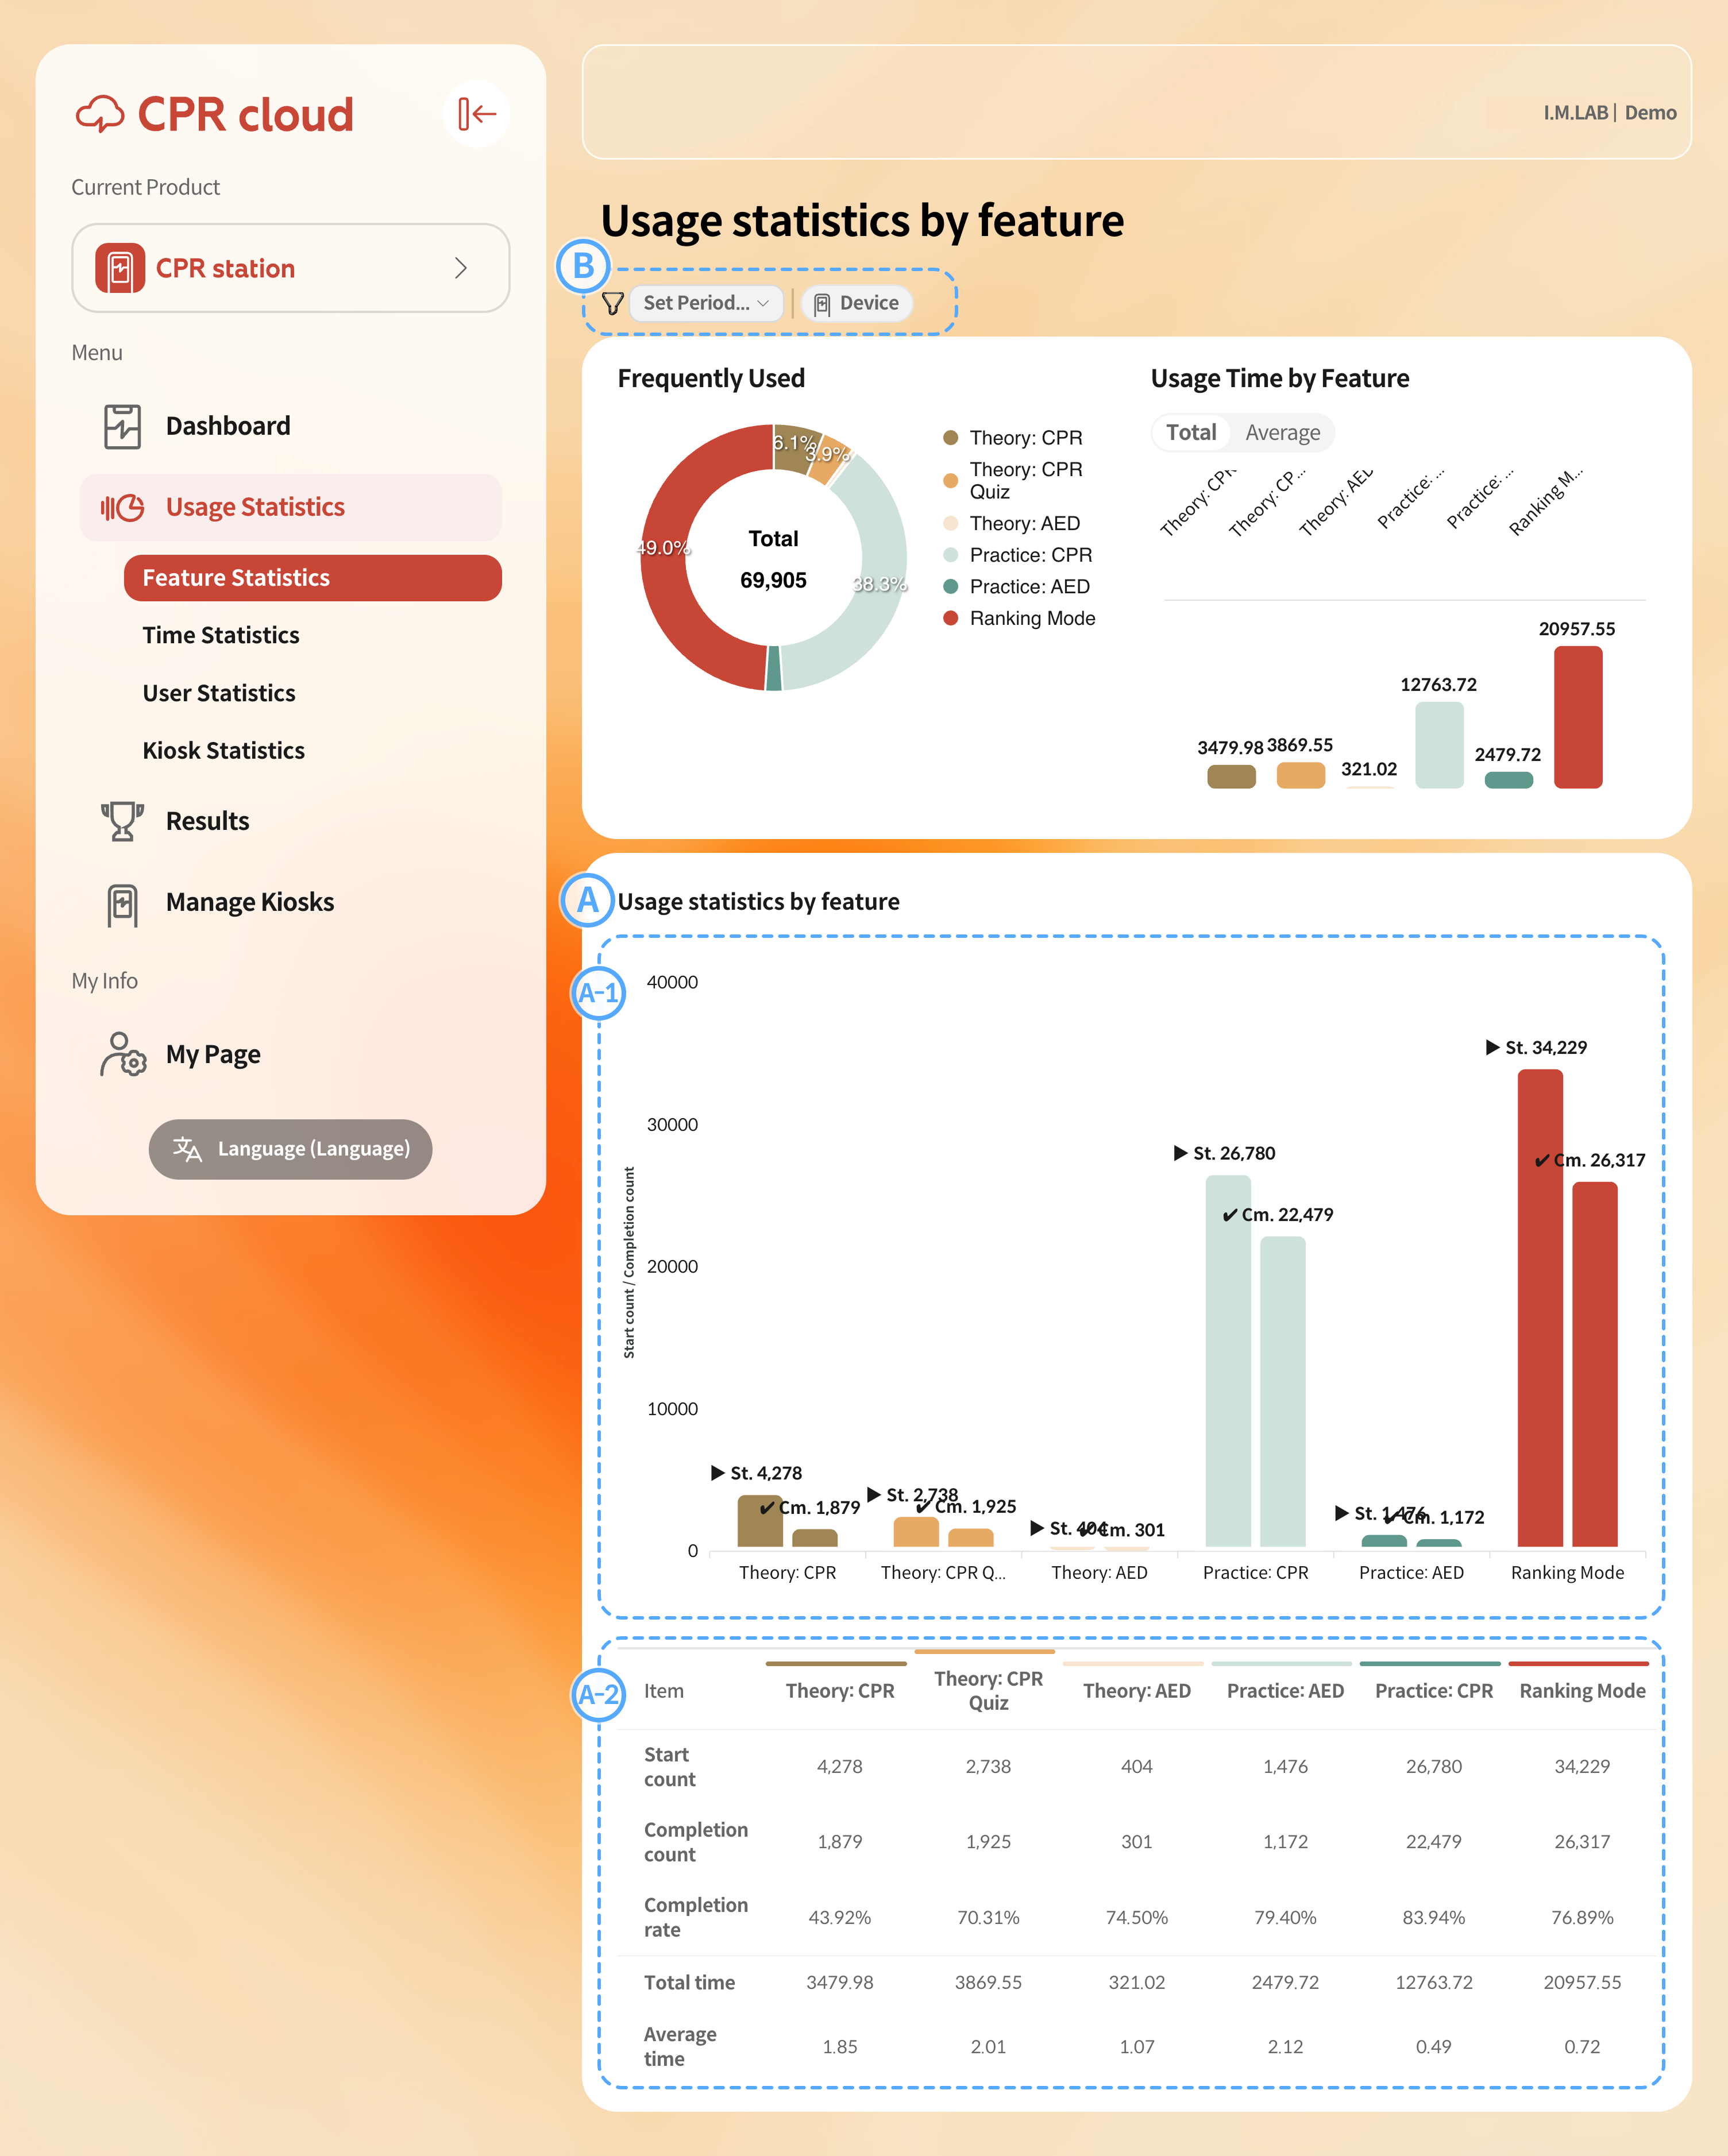
Feature Usage
A-1. Shows the number of times each function was started (▶︎) and completed (✔︎). The difference between these two numbers indicates how many users exited before completion.A-2. Displays the exact numerical values of each statistic in a table.
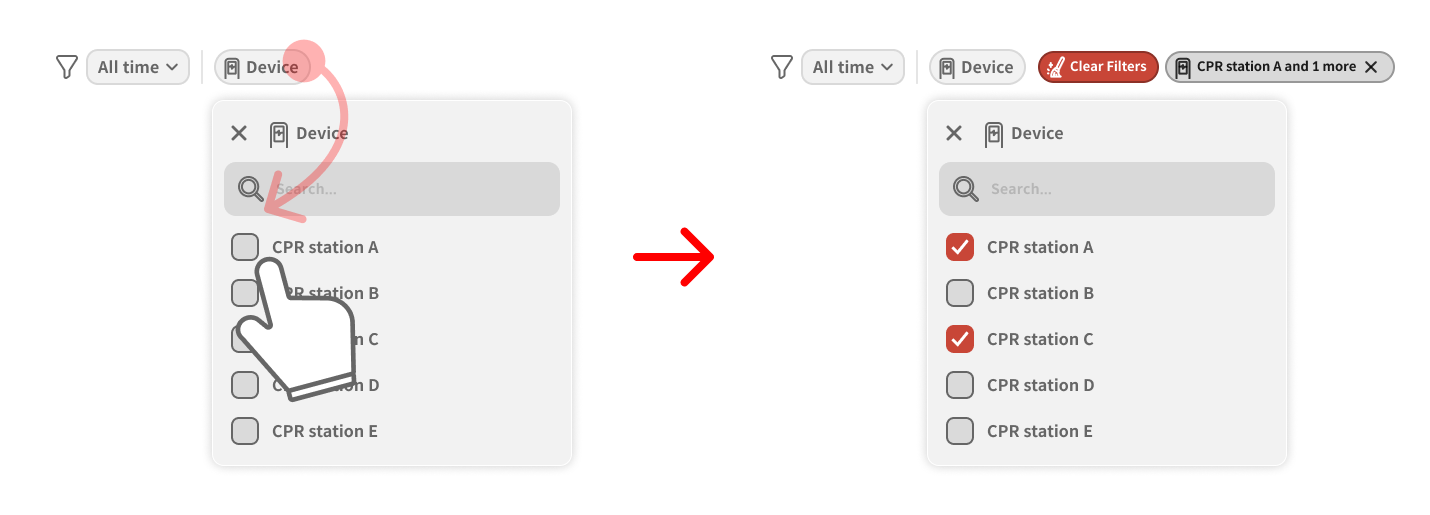
Filter : You can set the time range or add filtering conditions for the statistics. Recommended filters for each statistic are shown as separate chips.
Select the filter you wish to change, choose the filter condition, and it will be applied immediately. To remove applied filters, click the red
Clear Filtersbutton.The currently applied filters are displayed to the right of the red button. Click a chip to modify its condition, or press the X on the chip to remove it.
4.2.2. Time-based Statistics
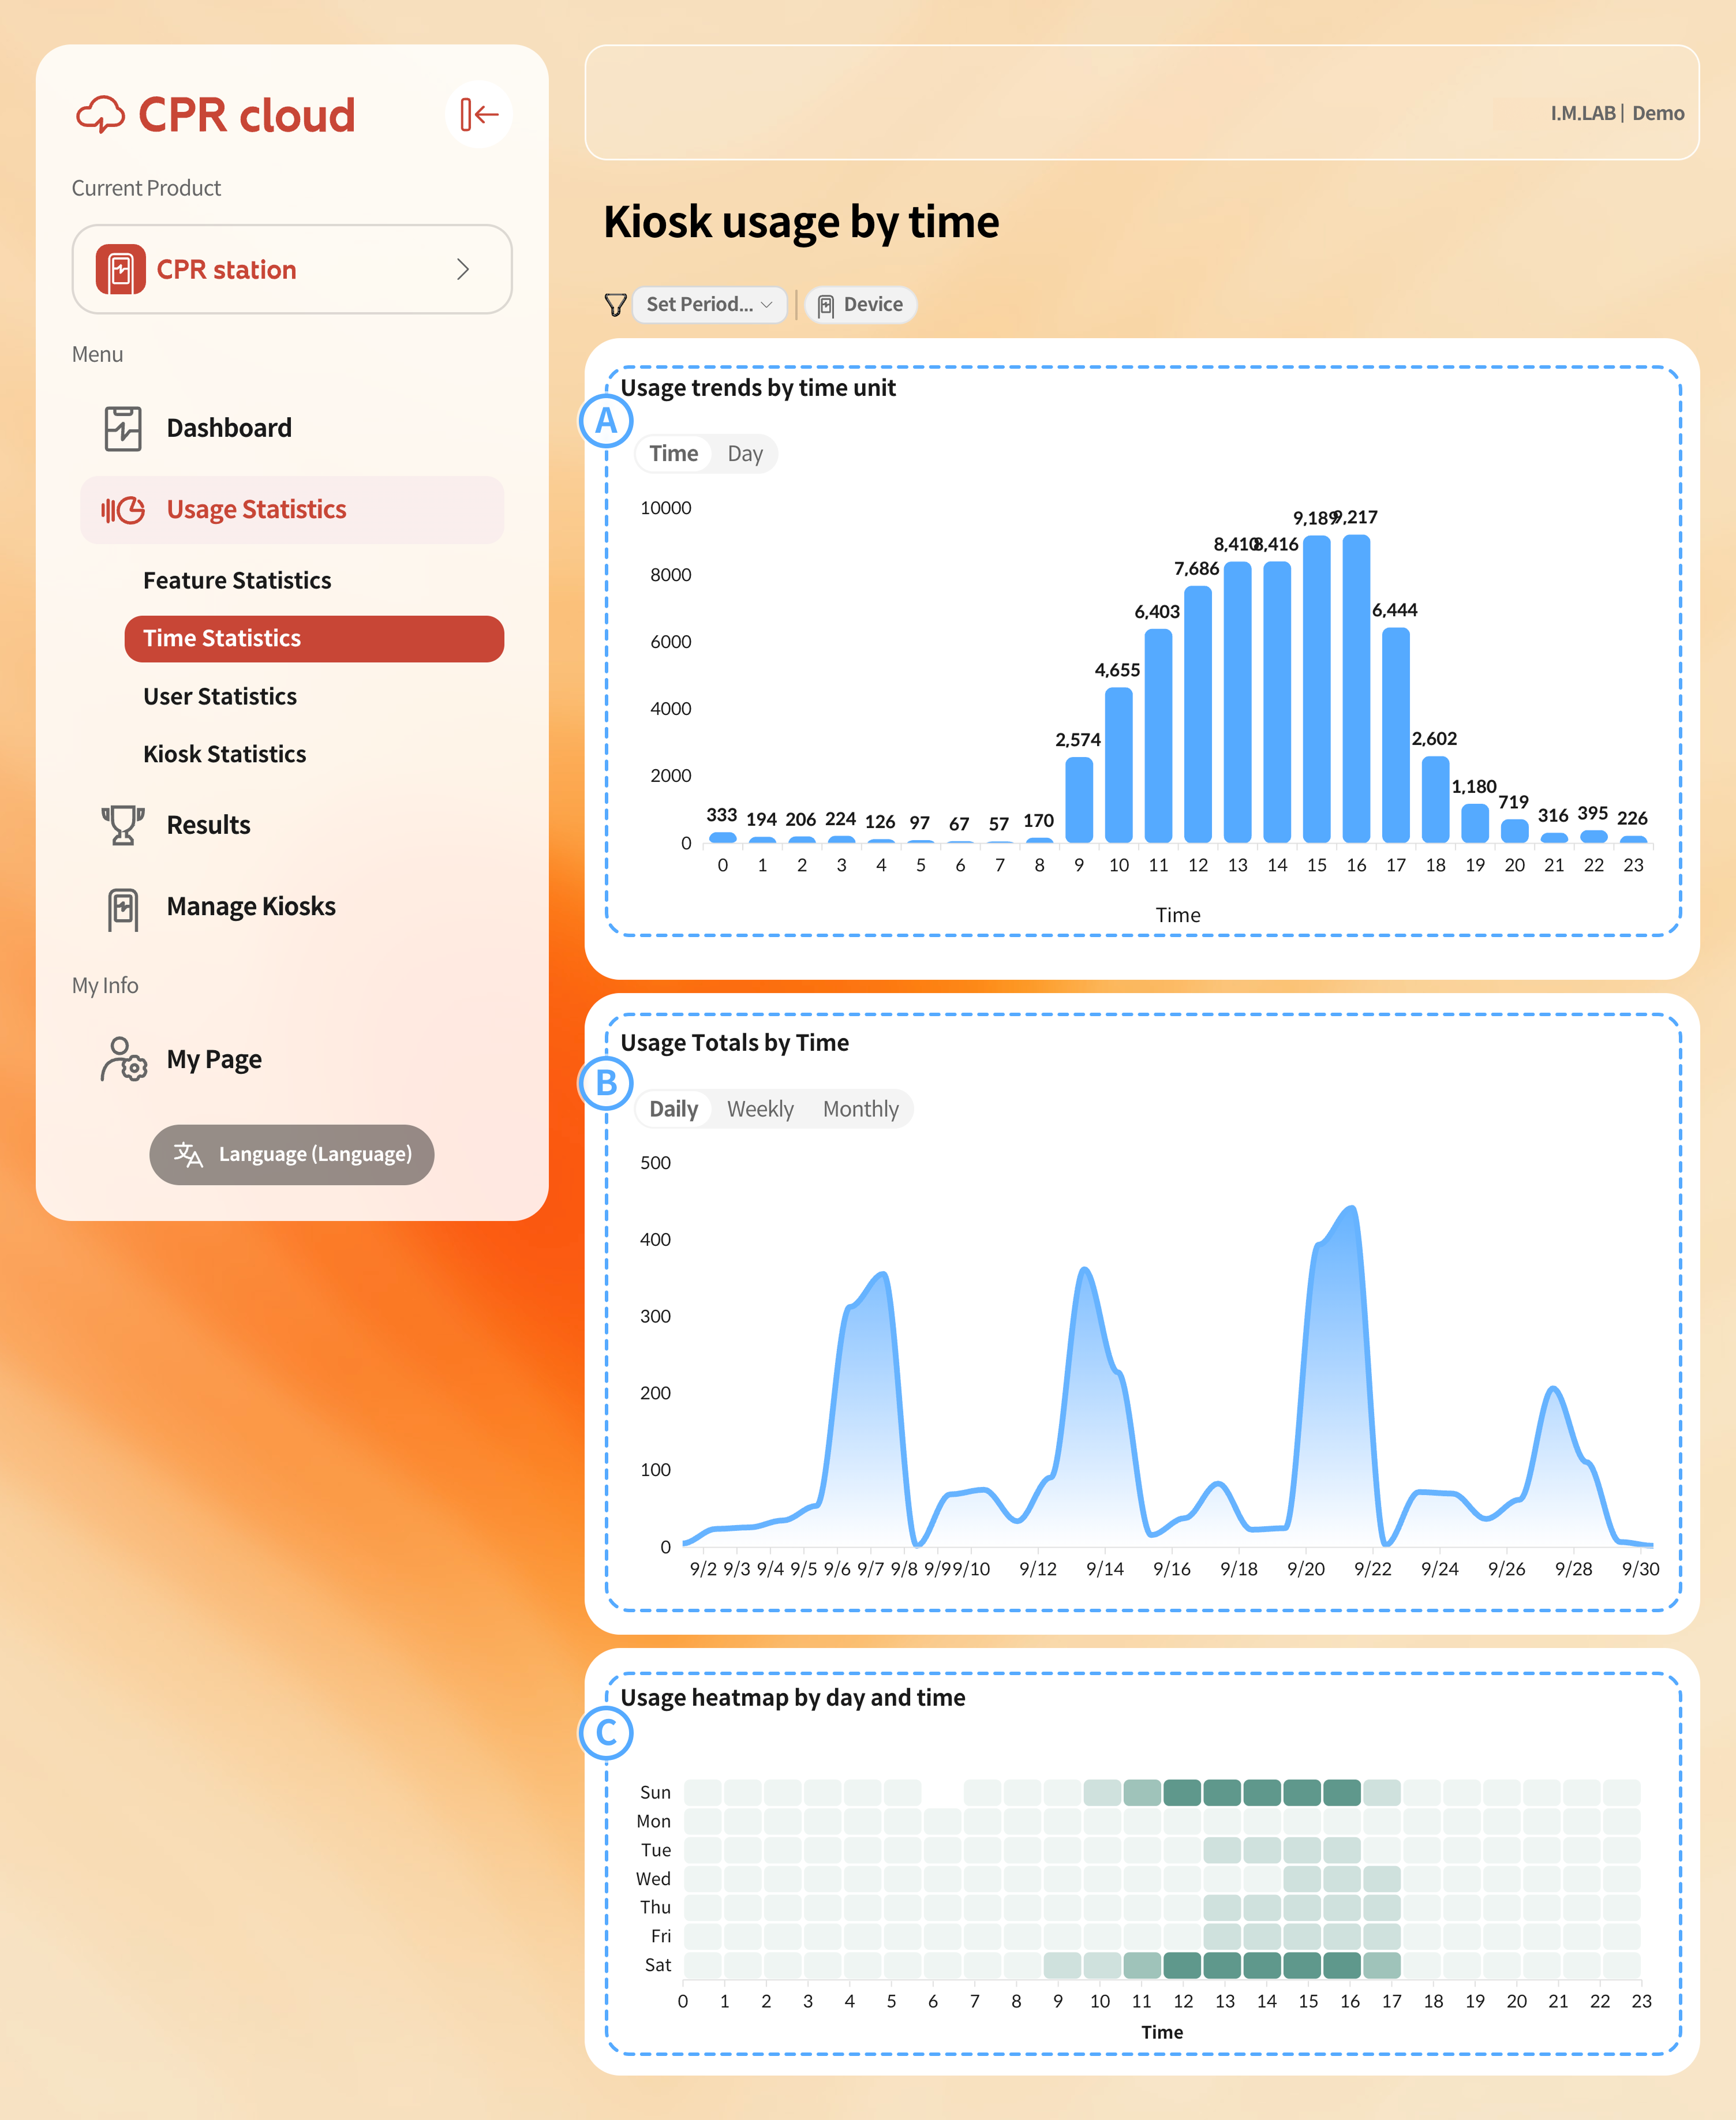
Usage Trend by Time: Displays the cumulative usage for each time period as a bar graph. You can change the segment filter to view usage by hour or by day of the week.
Usage Graph by time: Visualizes usage over time as a line graph for each time range. You can change the segment filter to view daily, weekly, or monthly usage statistics.
Heatmap: A visualized chart that shows which hours or days of the week have higher usage within a week. The darker the green color, the higher the usage for that time or day.
- Since colors represent relative usage, it is recommended to hover over or select a specific time block to check the actual usage value for accuracy.
Note:
If the selected filter period is shorter than the time span of the displayed graph (for example, if you filter by 1–2 weeks but display monthly or yearly statistics), the results may appear distorted or may not display correctly.
4.2.3. User-based Statistics
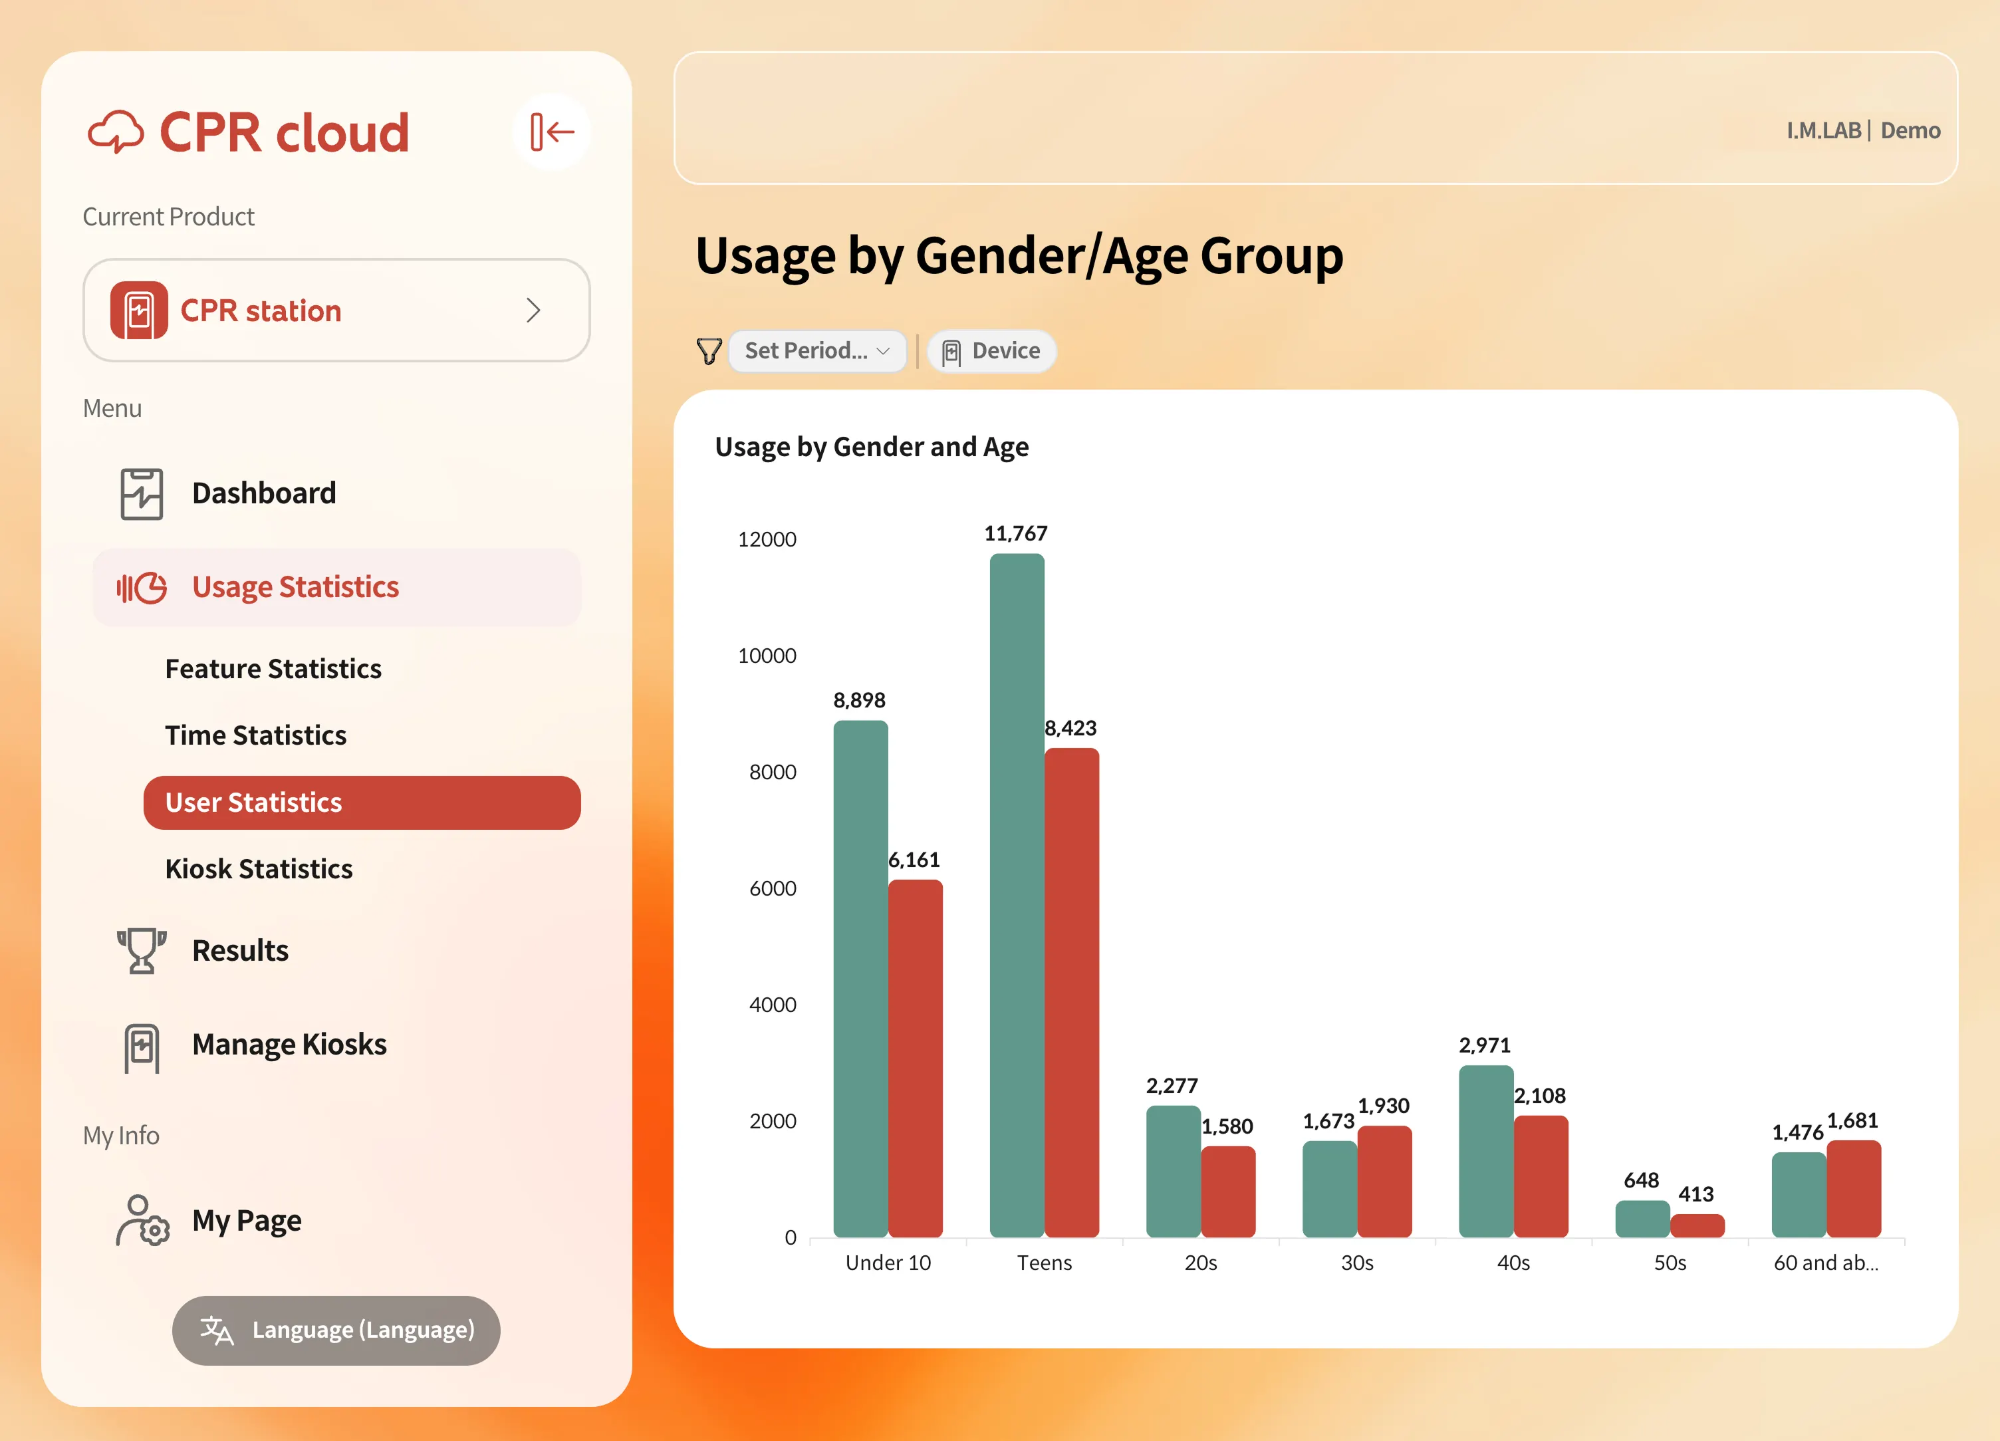
Displays usage by gender and age group in a bar chart. Green represents male users, and red represents female users.
4.2.4. Kiosk-based Statistics
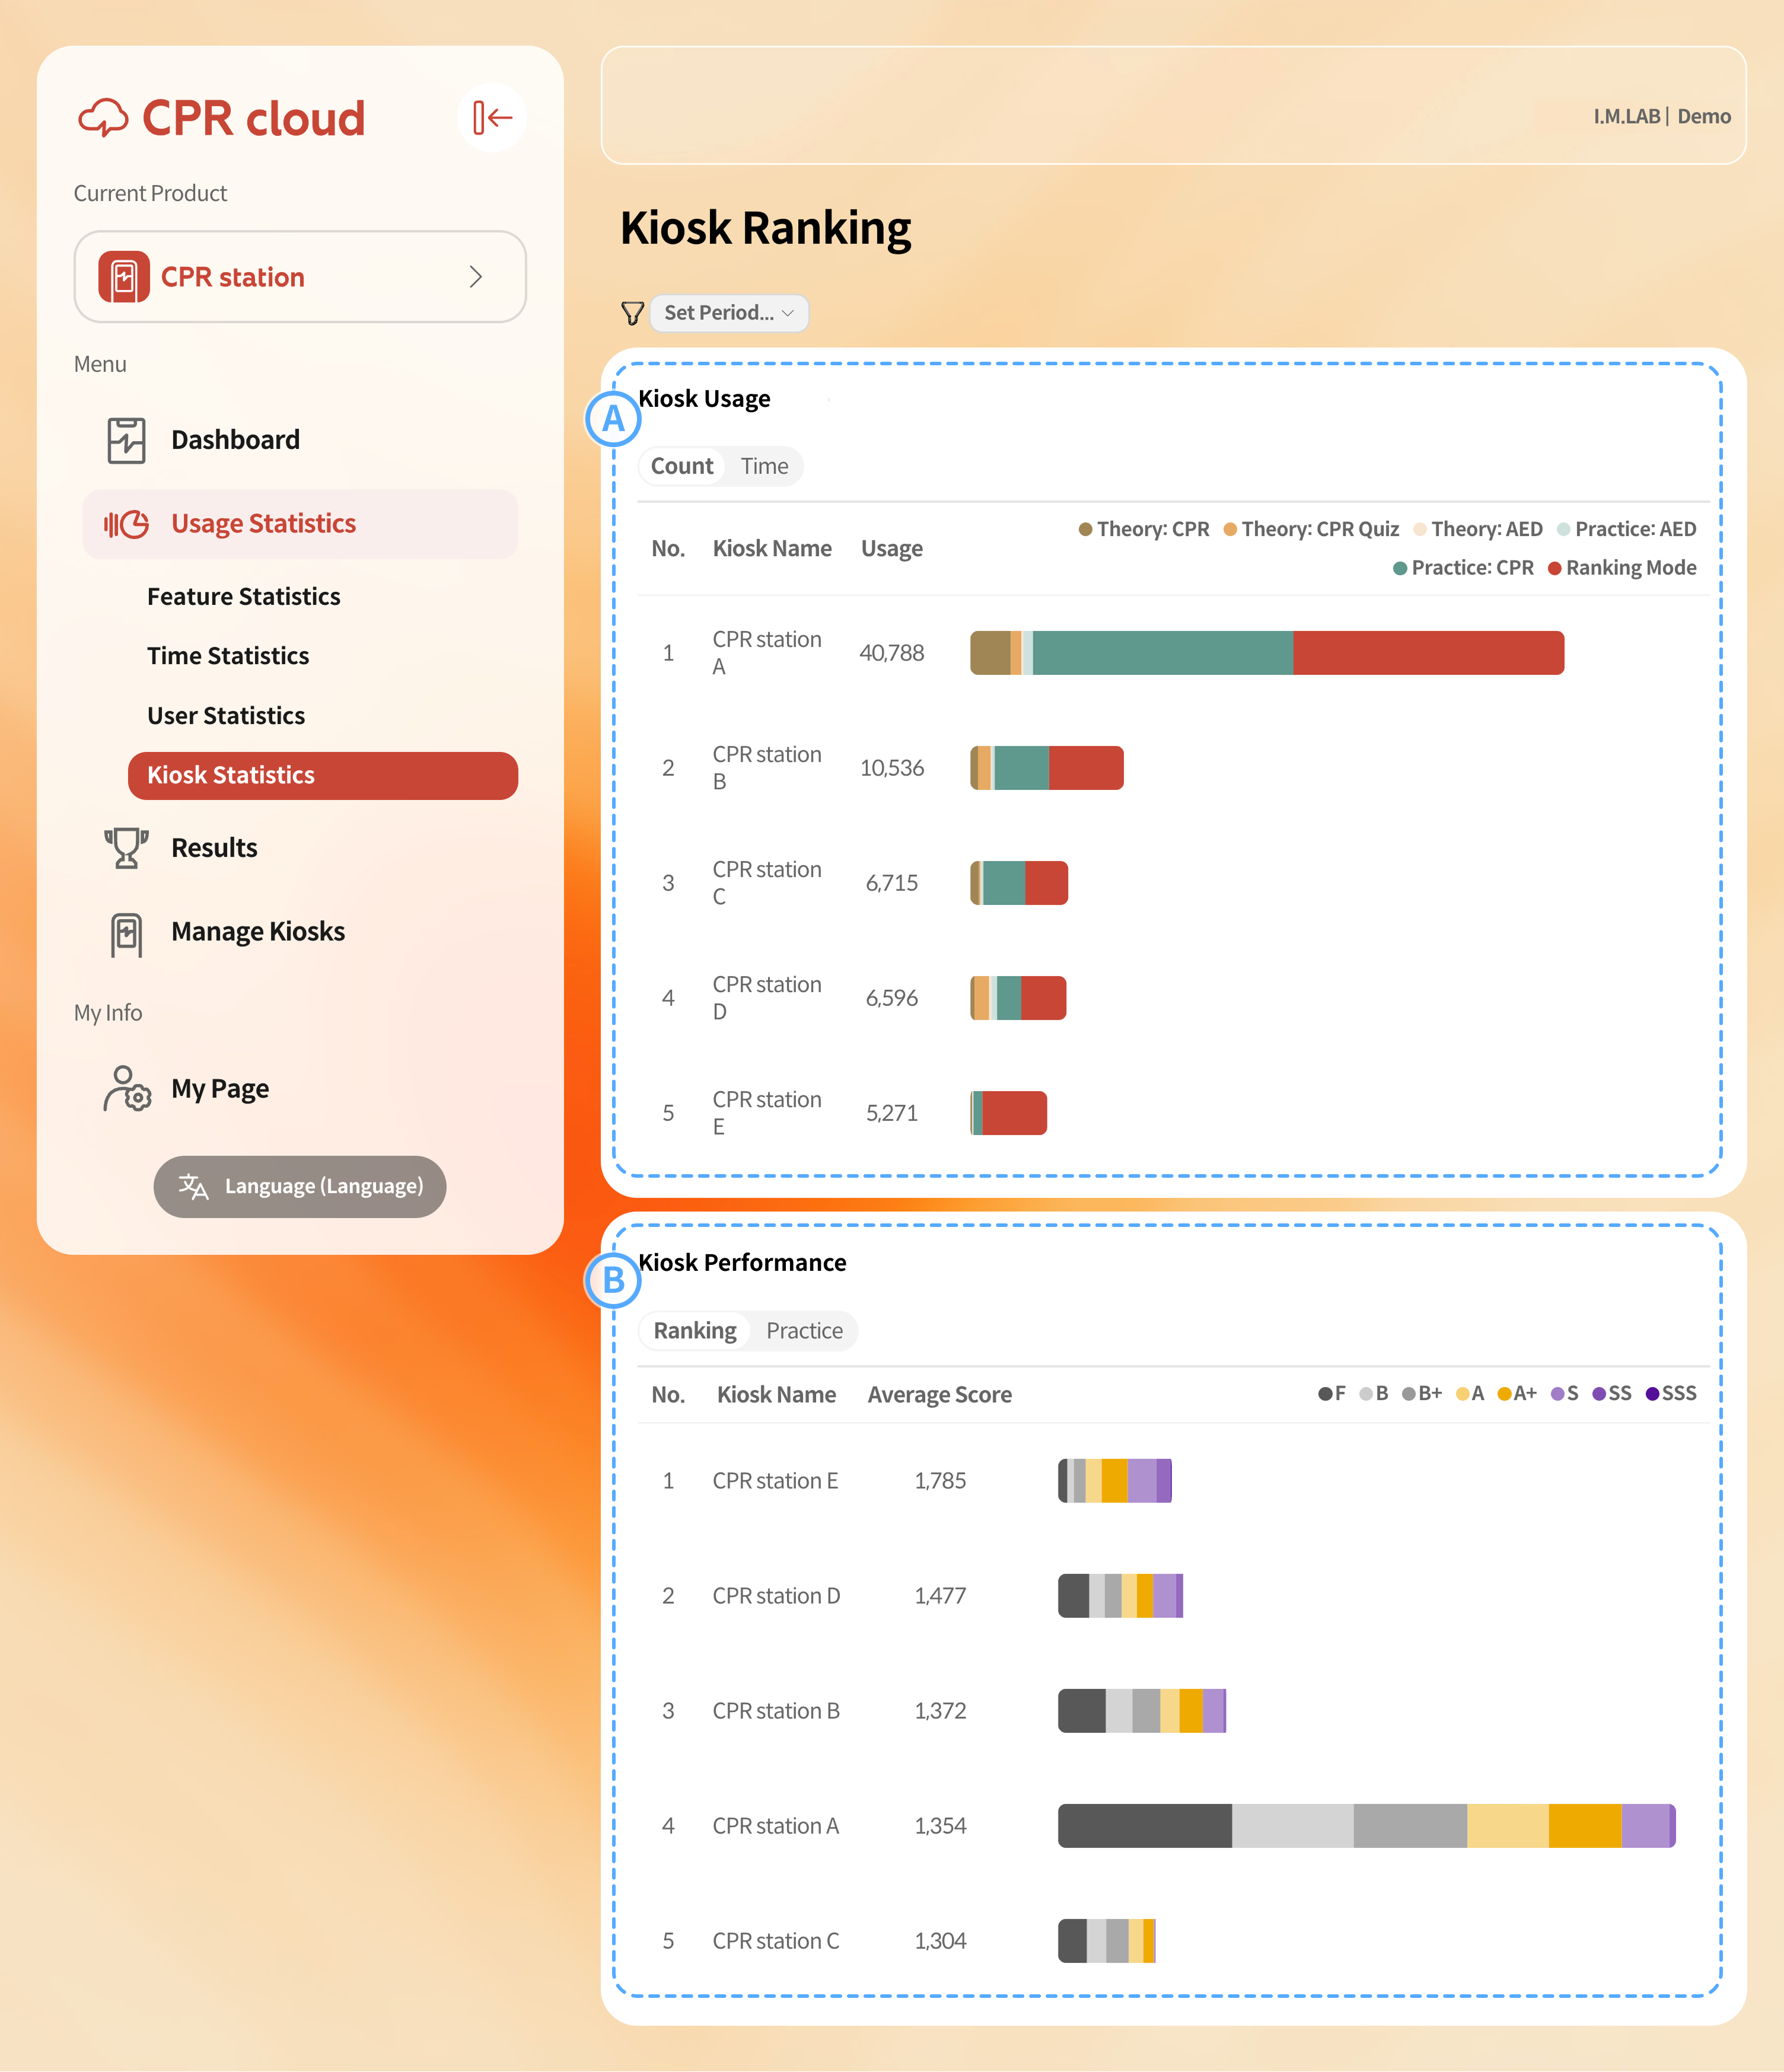
Kiosk Usage (by Feature): Displays each kiosk’s usage or operation time as a stacked bar chart by feature, allowing intuitive comparison of actual usage levels.
Scores by Kiosk: Displays each kiosk’s Ranking Mode or Practice Mode scores as a stacked bar chart. Kiosks with higher average scores from accumulated results appear at the top.
4.3. Results
Unlike the statistical sections, the Results menu displays all individual data synchronized from the devices (raw data). The All Results tab lists every record, while the Ranking tab shows only the top 100 records in Ranking Mode, based on the Resuscitation Score.
4.3.1. All Results
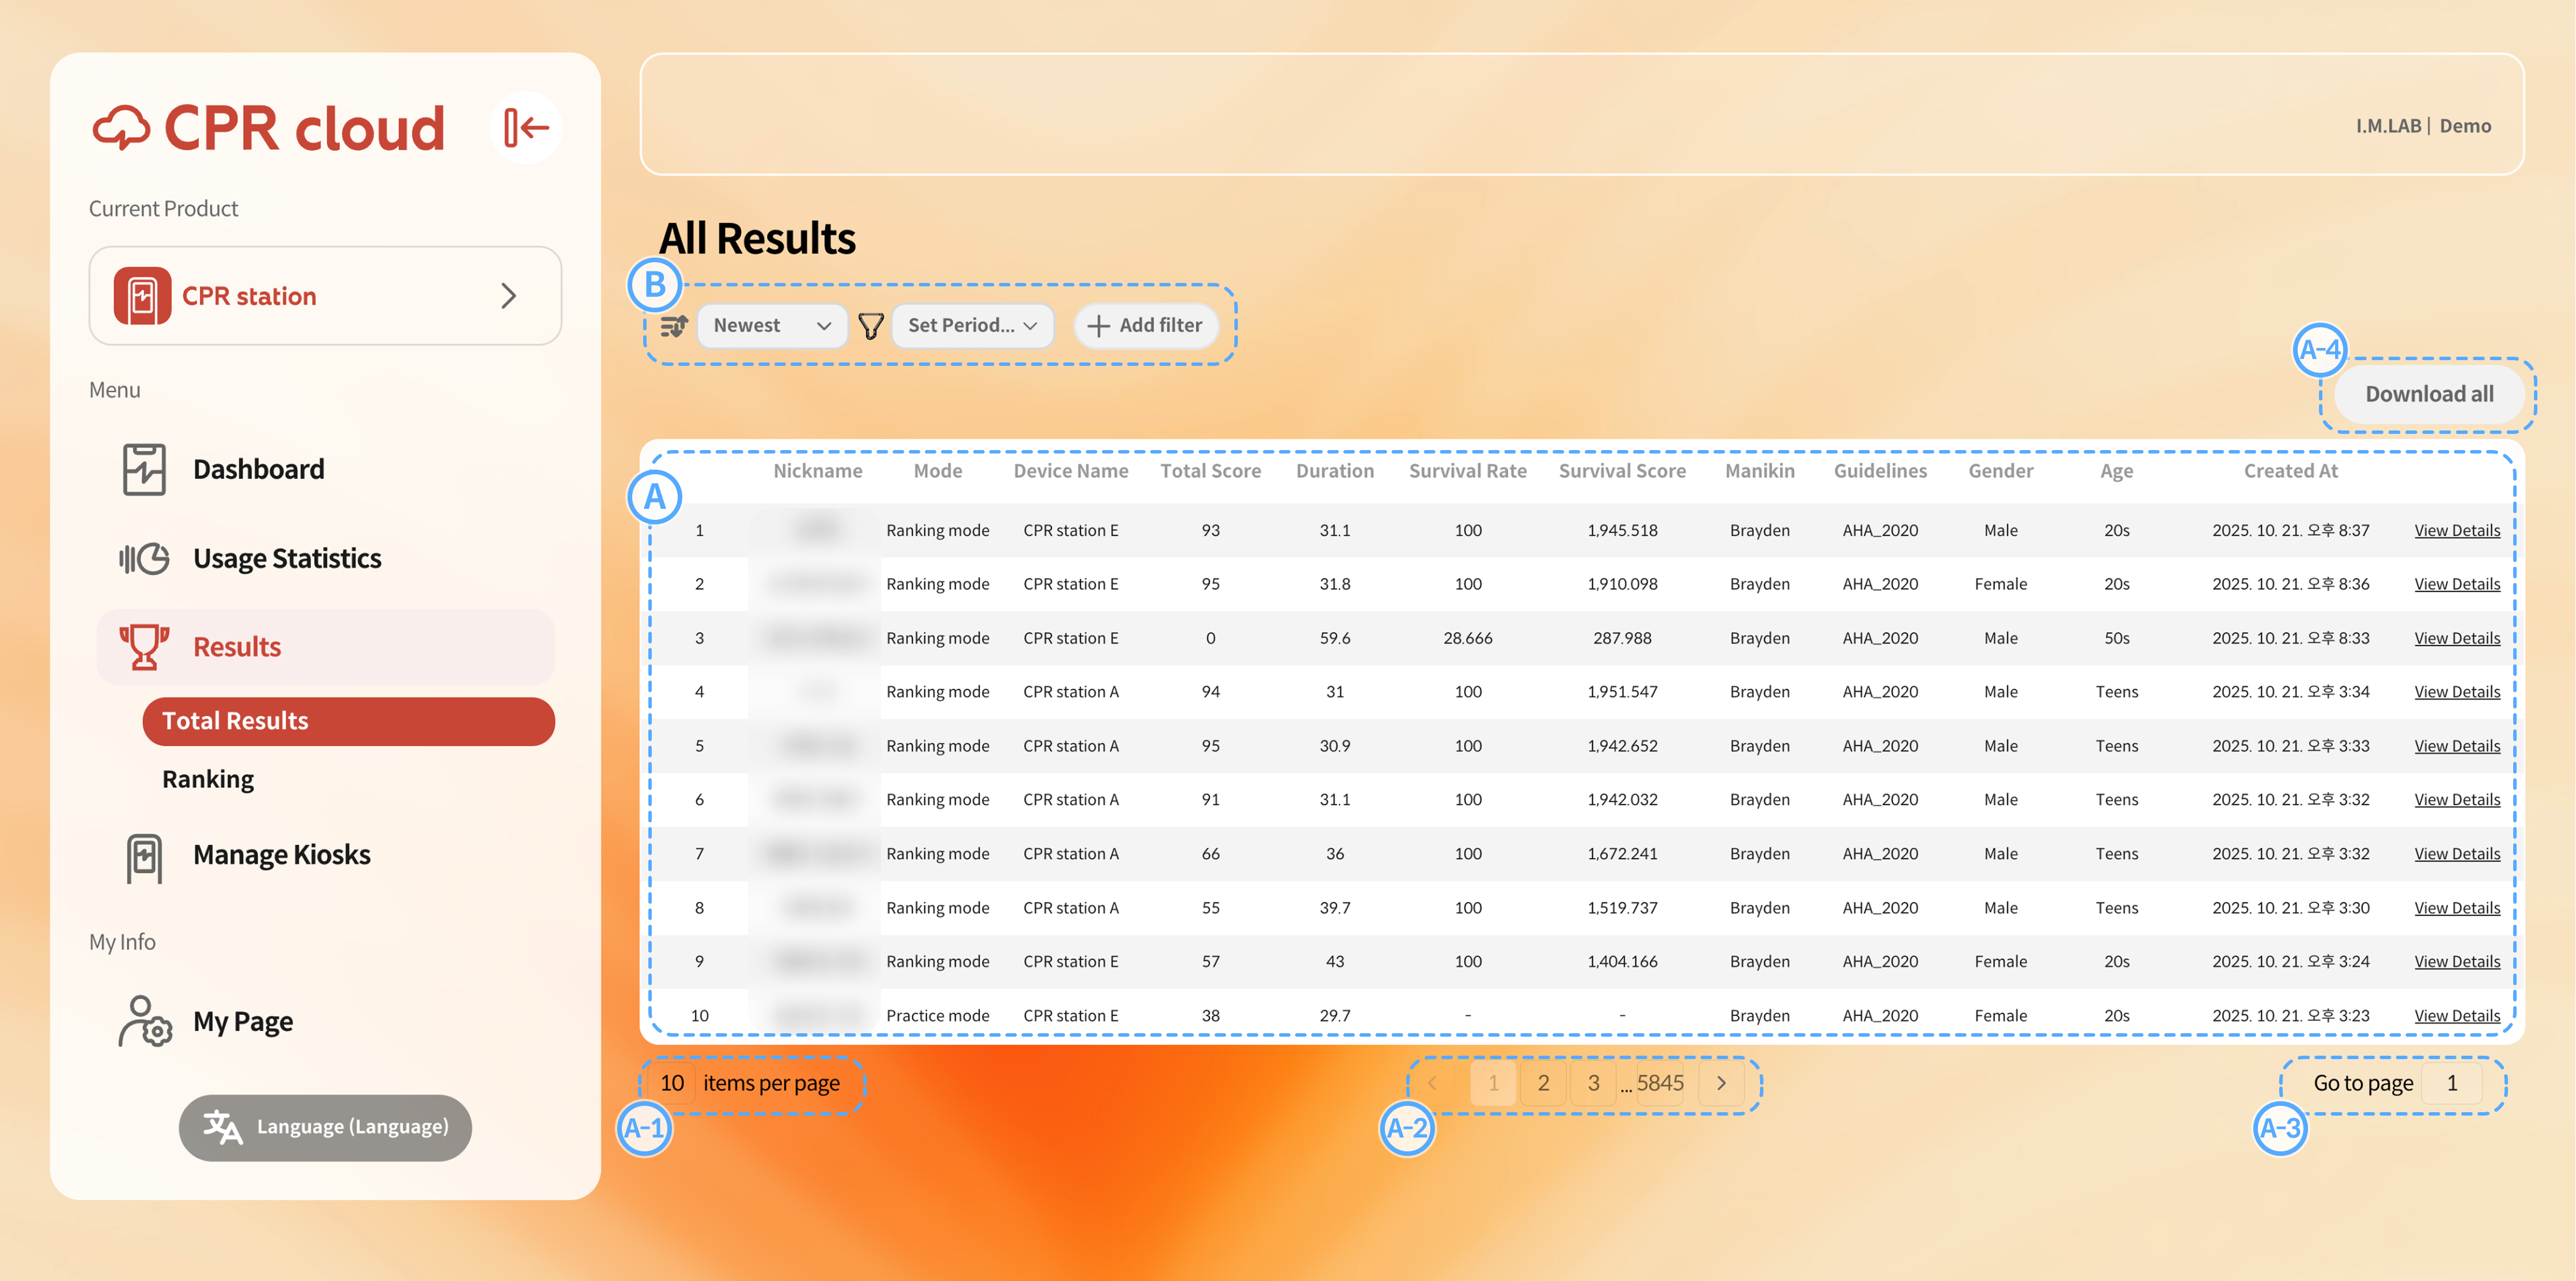
All Results Table: Each record includes nickname, mode, device name, score, measurement time, resuscitation score, manikin type, applied guideline, and creation time. When the user provides demographic data, gender and age group are also saved. Selecting Detailed Result in the last column opens a certificate-style detailed report.
A-1. You can set the number of results displayed per page.A-2. You can move to a specific page using pagination controls.
A-3. If you need to skip multiple pages, you can directly enter a target page number.
A-4. You can save the currently displayed results. If filters are applied, only the filtered results will be downloaded.
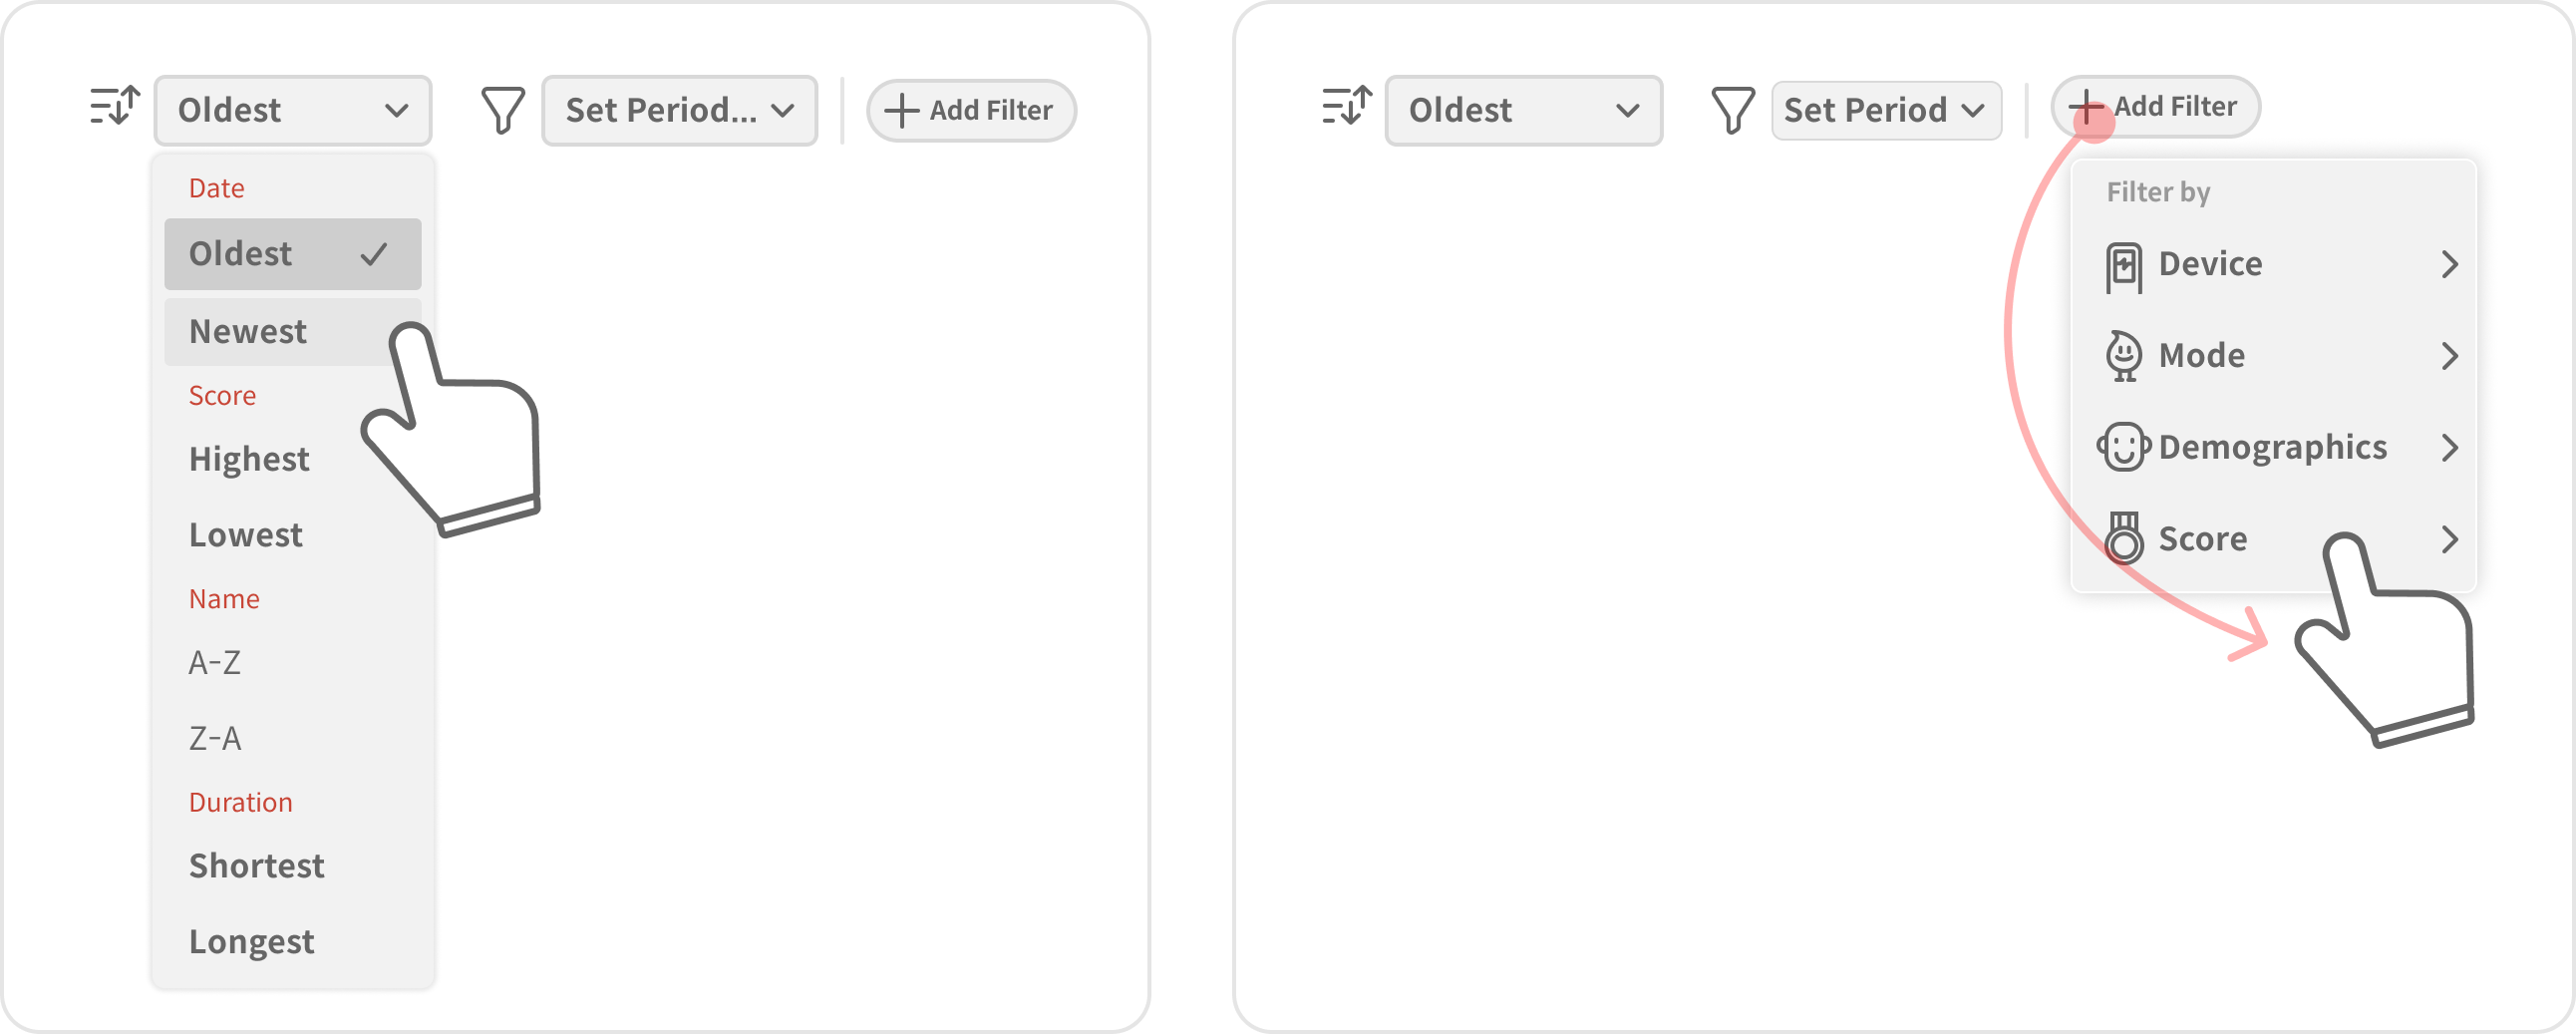
Sorting and Filters: You can change sorting conditions or add filters.
Change Sorting: Use the first dropdown menu to change the sorting condition. You can sort by creation date, resuscitation score, nickname, or session duration, in ascending or descending order.
Change Filters: Click + Add Filter to add a new filter. To modify or remove a filter, refer to B. Filter in 4.2.1. Feature Statistics.
Nickname: The name entered by the user on the kiosk, or an automatically generated name.
Mode: The session mode in which the record was created (Practice / Ranking).
Device Name: The name of the kiosk used by the user.
Total Score: The overall CPR performance score out of 100 points.
( See: Score calculation for CPR Add-on Kit apps (compatible with Universal CPR Add-on Kit & cprCUBE PRO))Duration: The length of time the session ran.
Resuscitation Score: The cumulative CPR performance score achieved during the session. (No fixed maximum, but practically around 2000 points due to time limits.)
Manikin: The type of manikin used for the record.
Guideline: The CPR guideline applied as the evaluation standard.
Age Group: The age group selected by the respondent.
Created Time: The time when the session was completed and saved.
4.3.2. Ranking
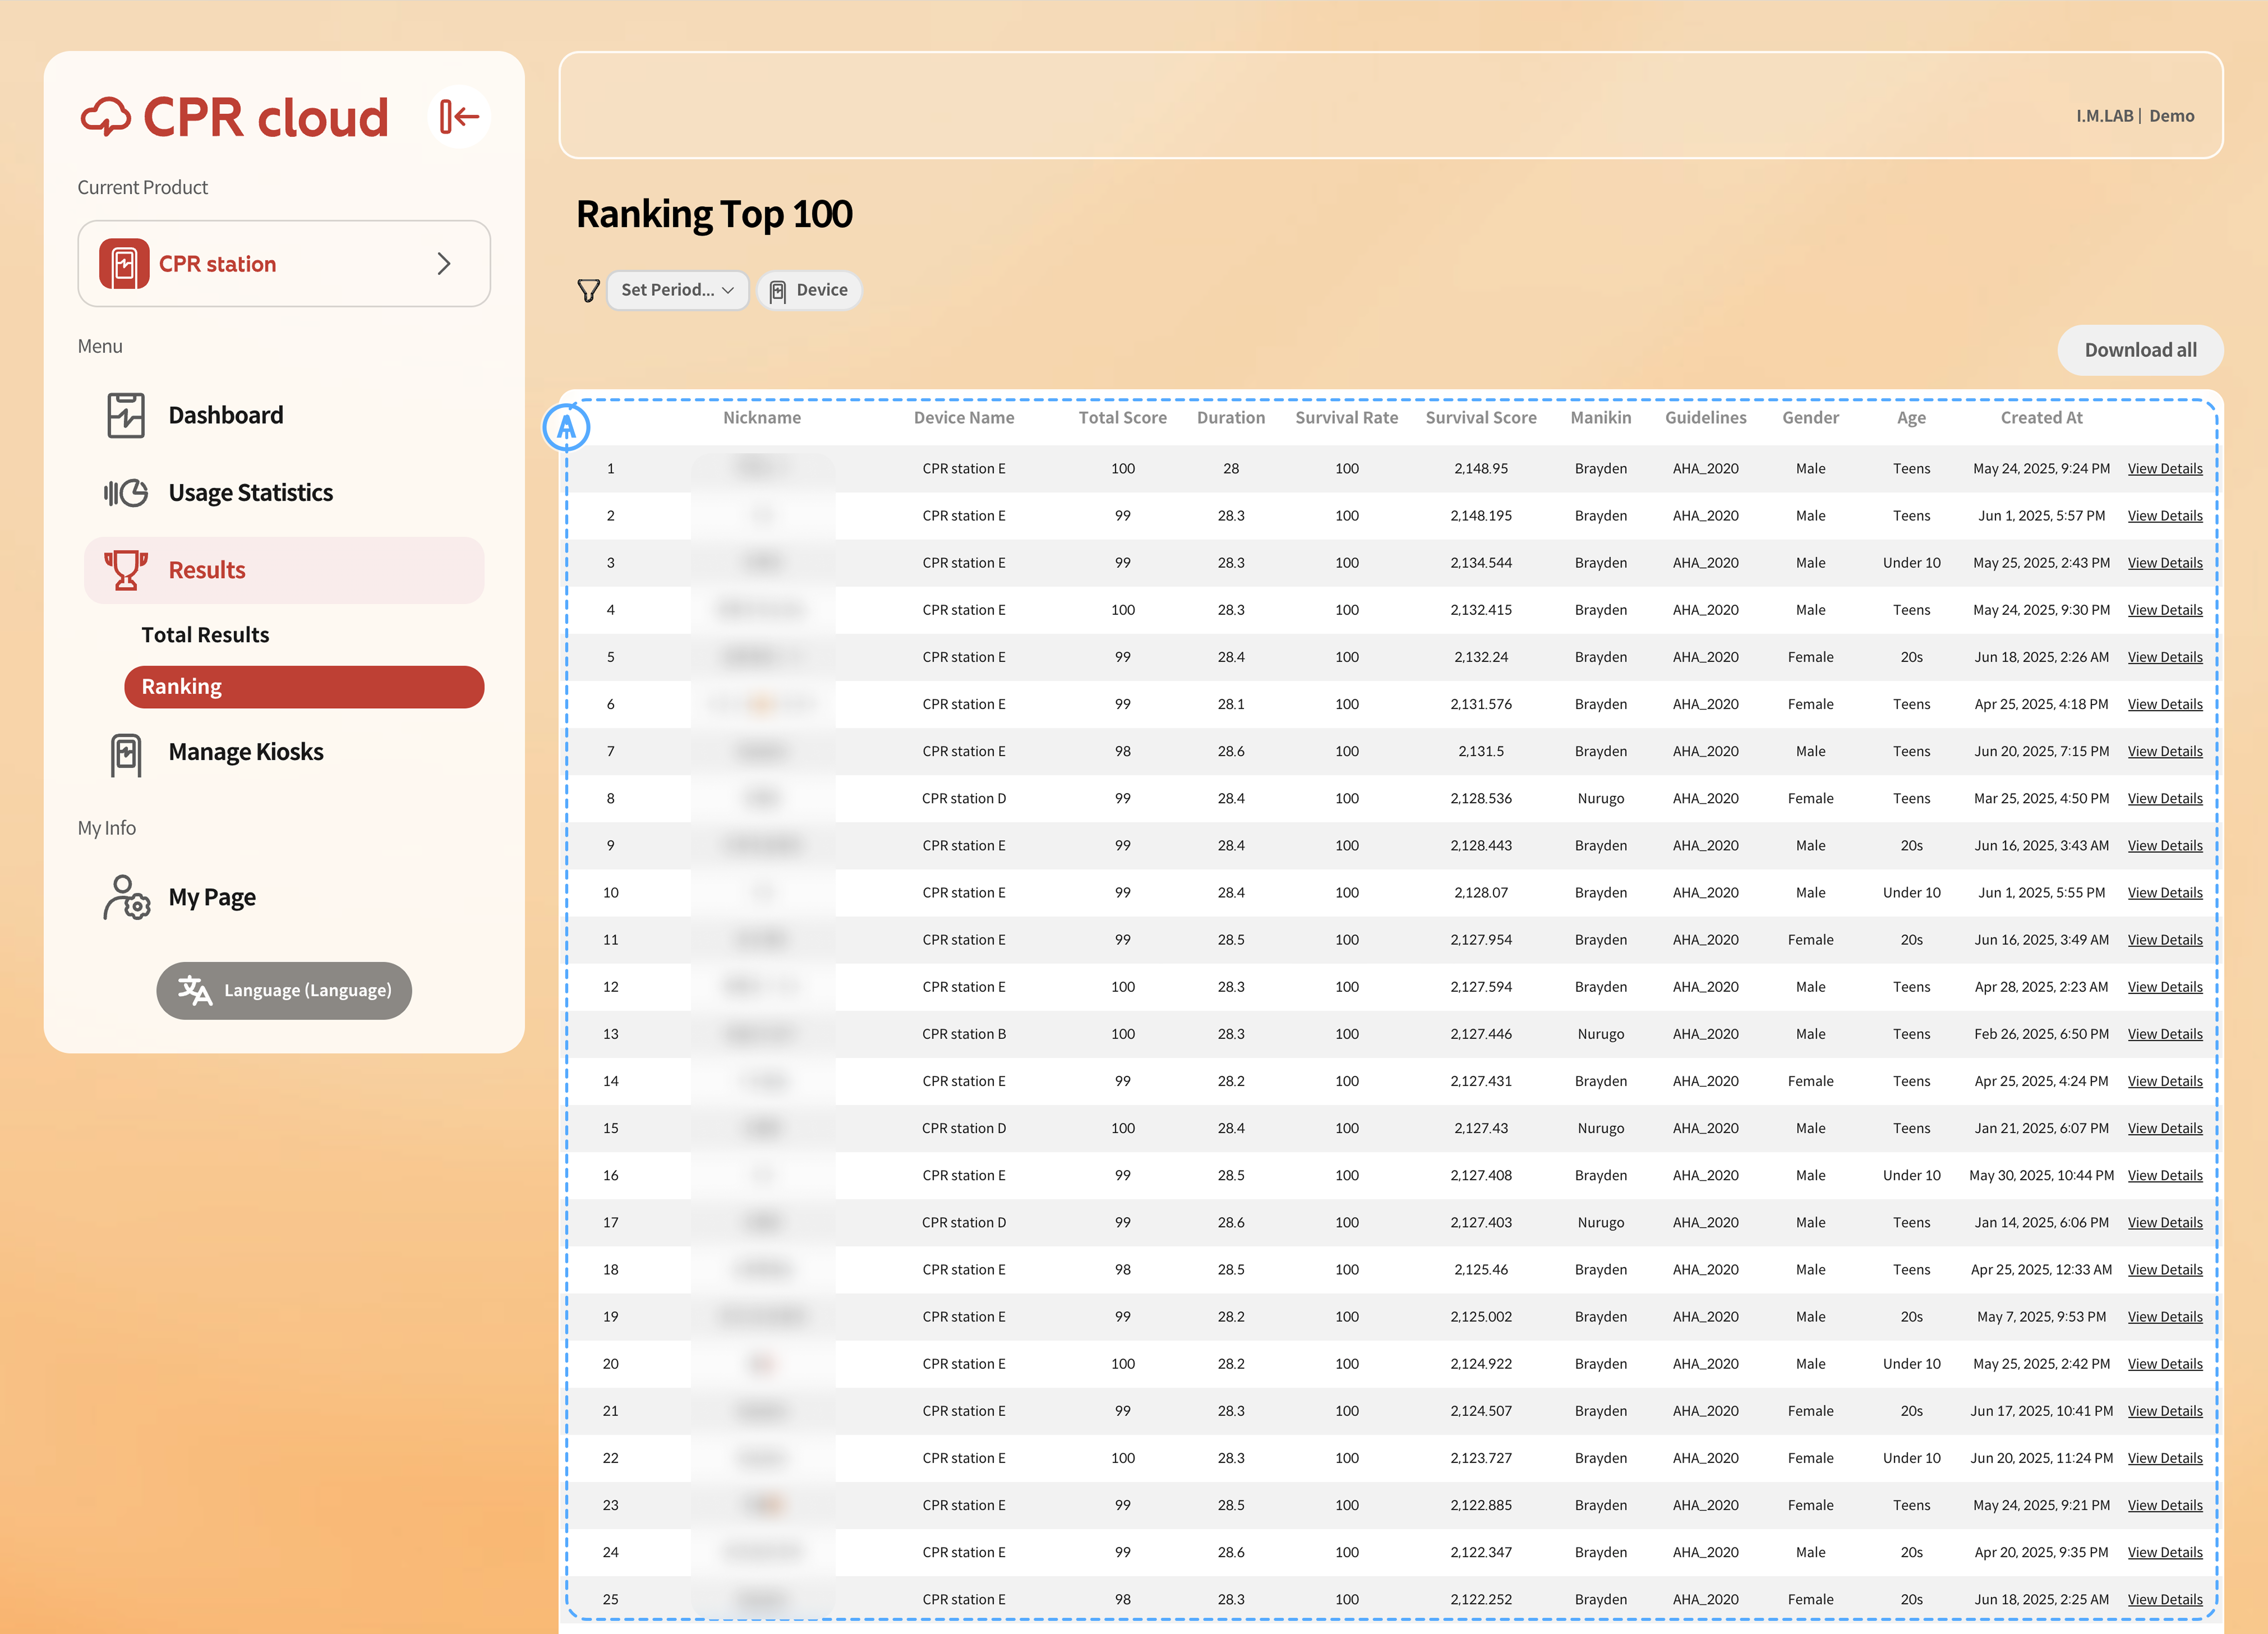
Ranking Table: Displays results ranked from 1st to 100th based on the Resuscitation Score. You can adjust the ranking range by changing the period or filtering conditions.
4.3.3. Results by User Enterprise
In the Enterprise model, users are managed by their unique identifiers (e.g., employee number or student ID), allowing administrators to view accumulated results for each individual. Rankings are displayed based on the Resuscitation Score, and you can adjust them by changing the time period or filter conditions.
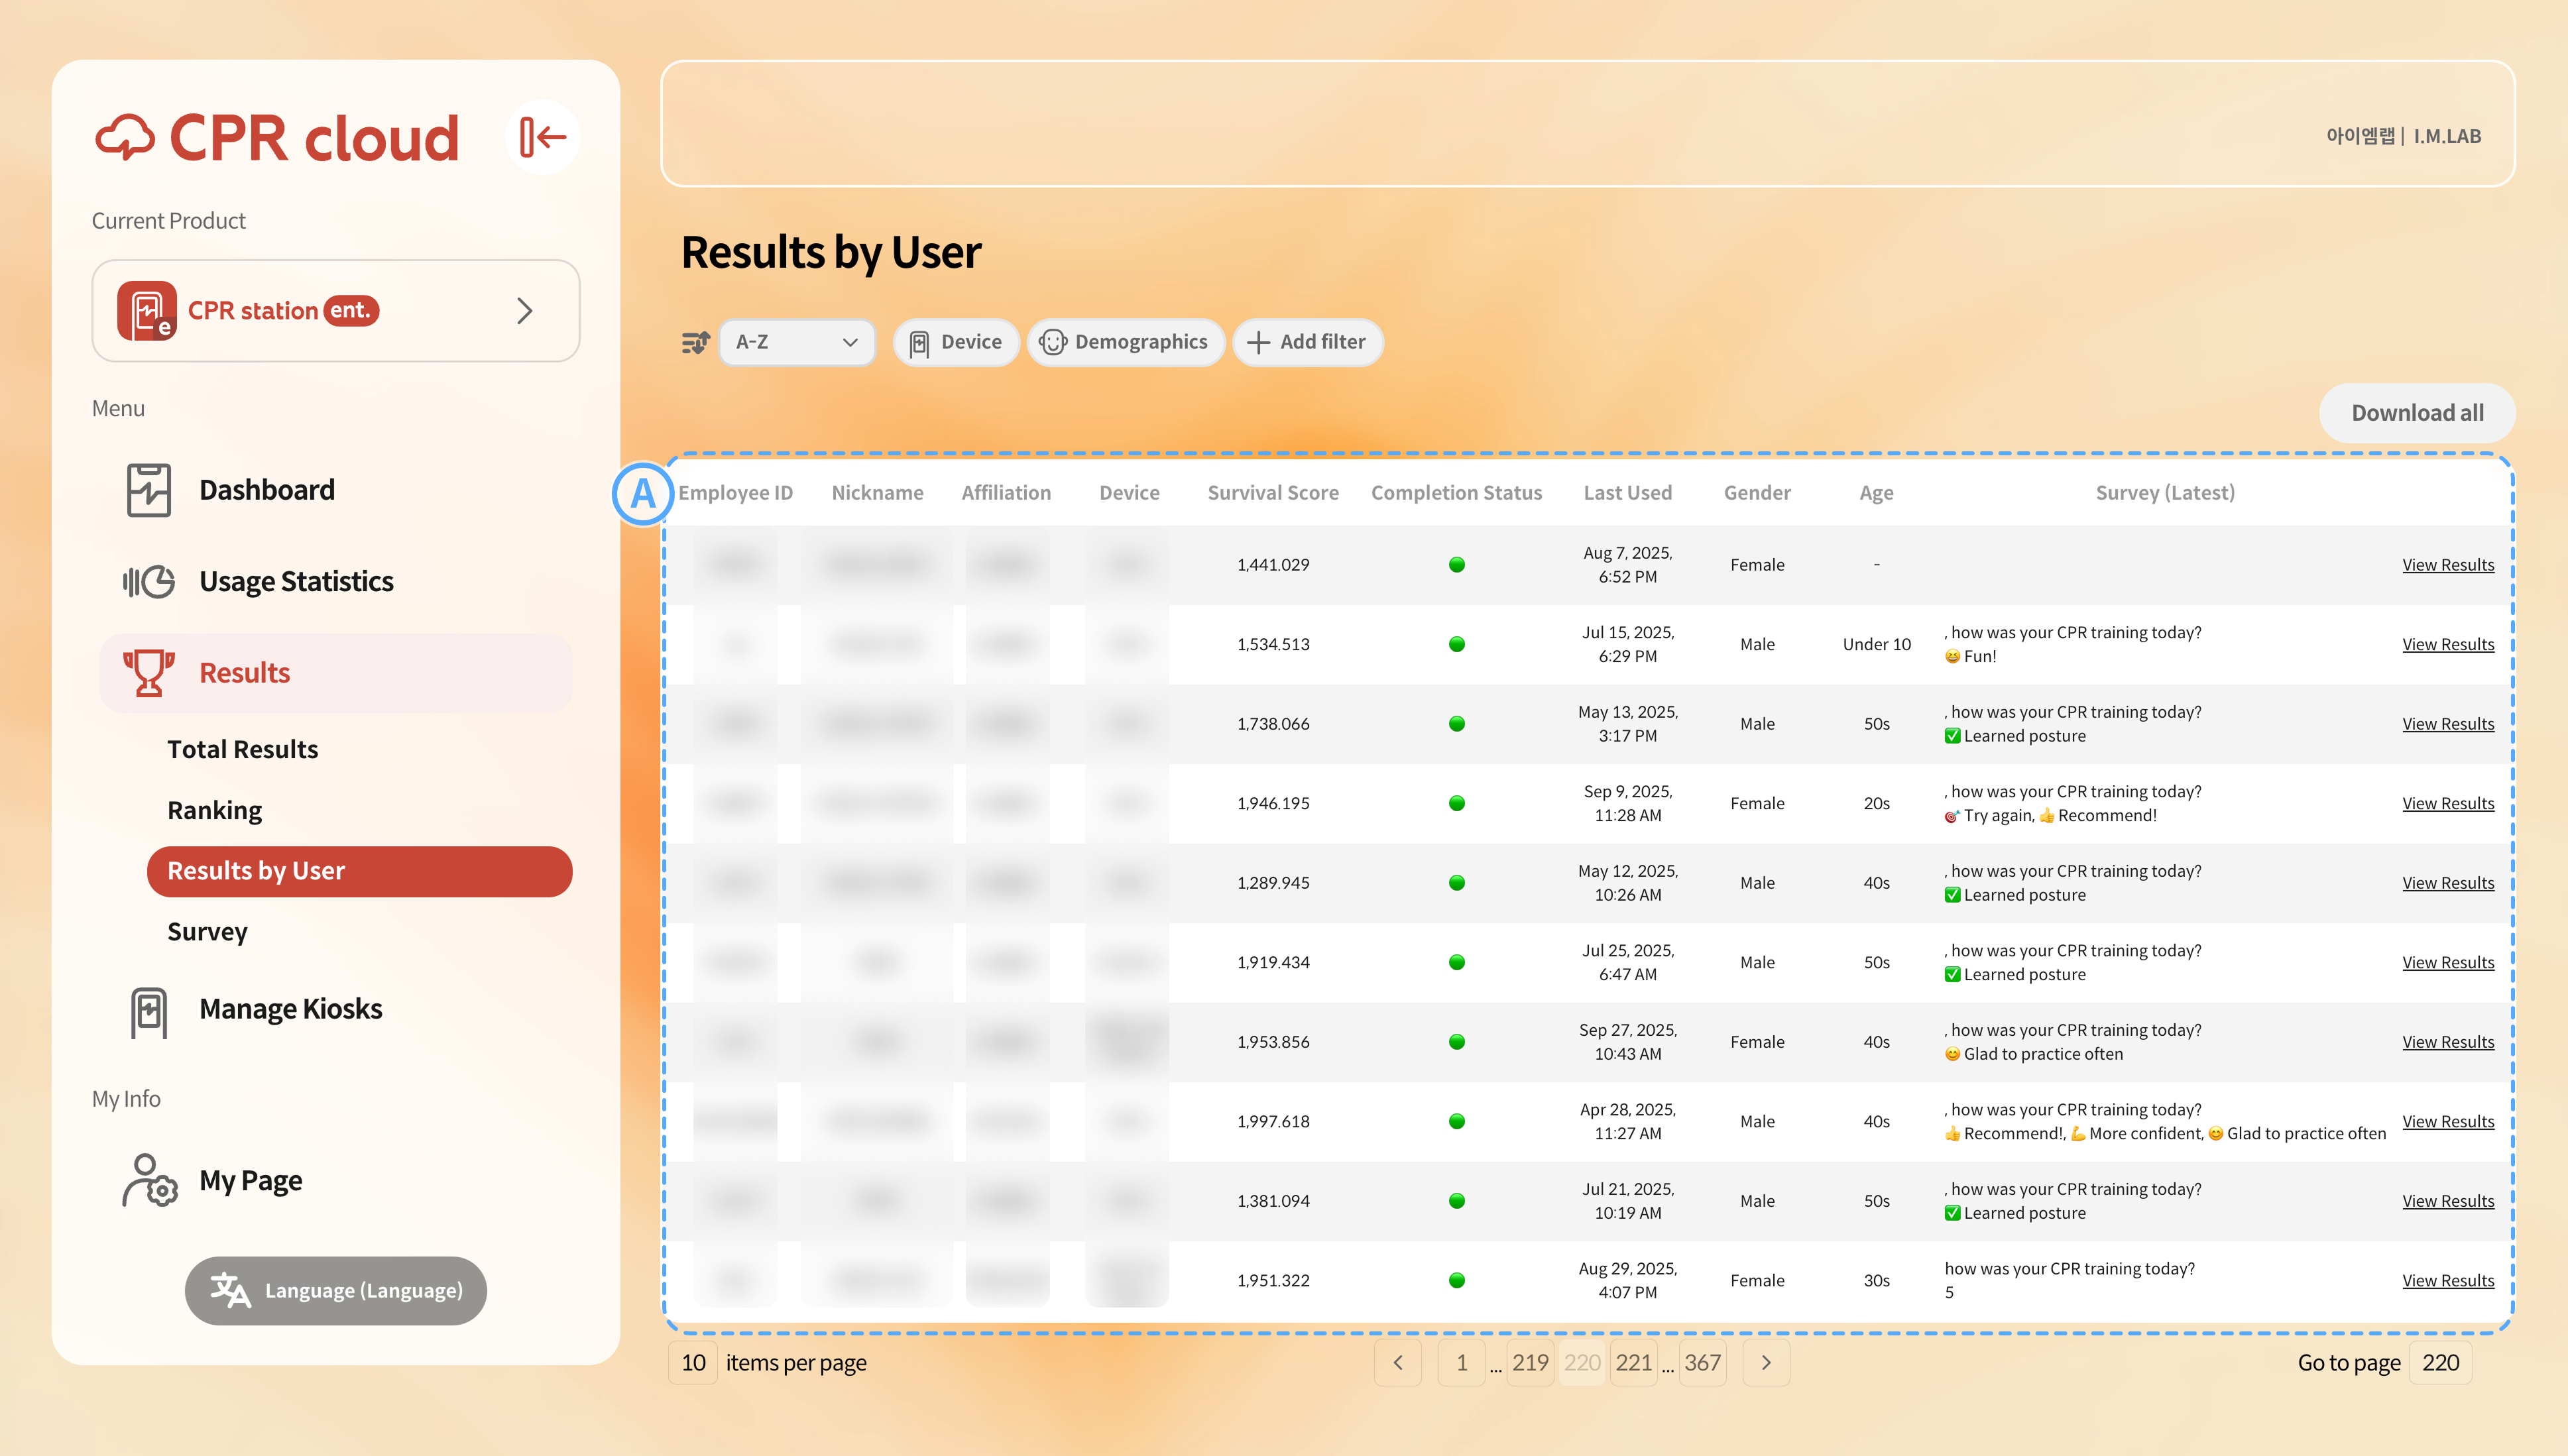
Recent User Activity Table: Displays recent records by user. Selecting View Results shows all records for that individual.
Employee ID: The identifier entered by the user, used to distinguish each person.
Nickname: The nickname used in the session where the record was created (Practice/Ranking).
Affiliation: The department or group selected by the user from the administrator’s predefined list.
Device Name: The name of the kiosk used by the user.
Completion Status: Indicates whether the user has met the organization’s completion criteria. By default, completing a session in Ranking Mode is marked as completed.
Last Used: The most recent time of recorded activity.
Gender and Age: The gender and age group provided by the user.
Survey (Latest): Displays the most recent survey response submitted by the user.
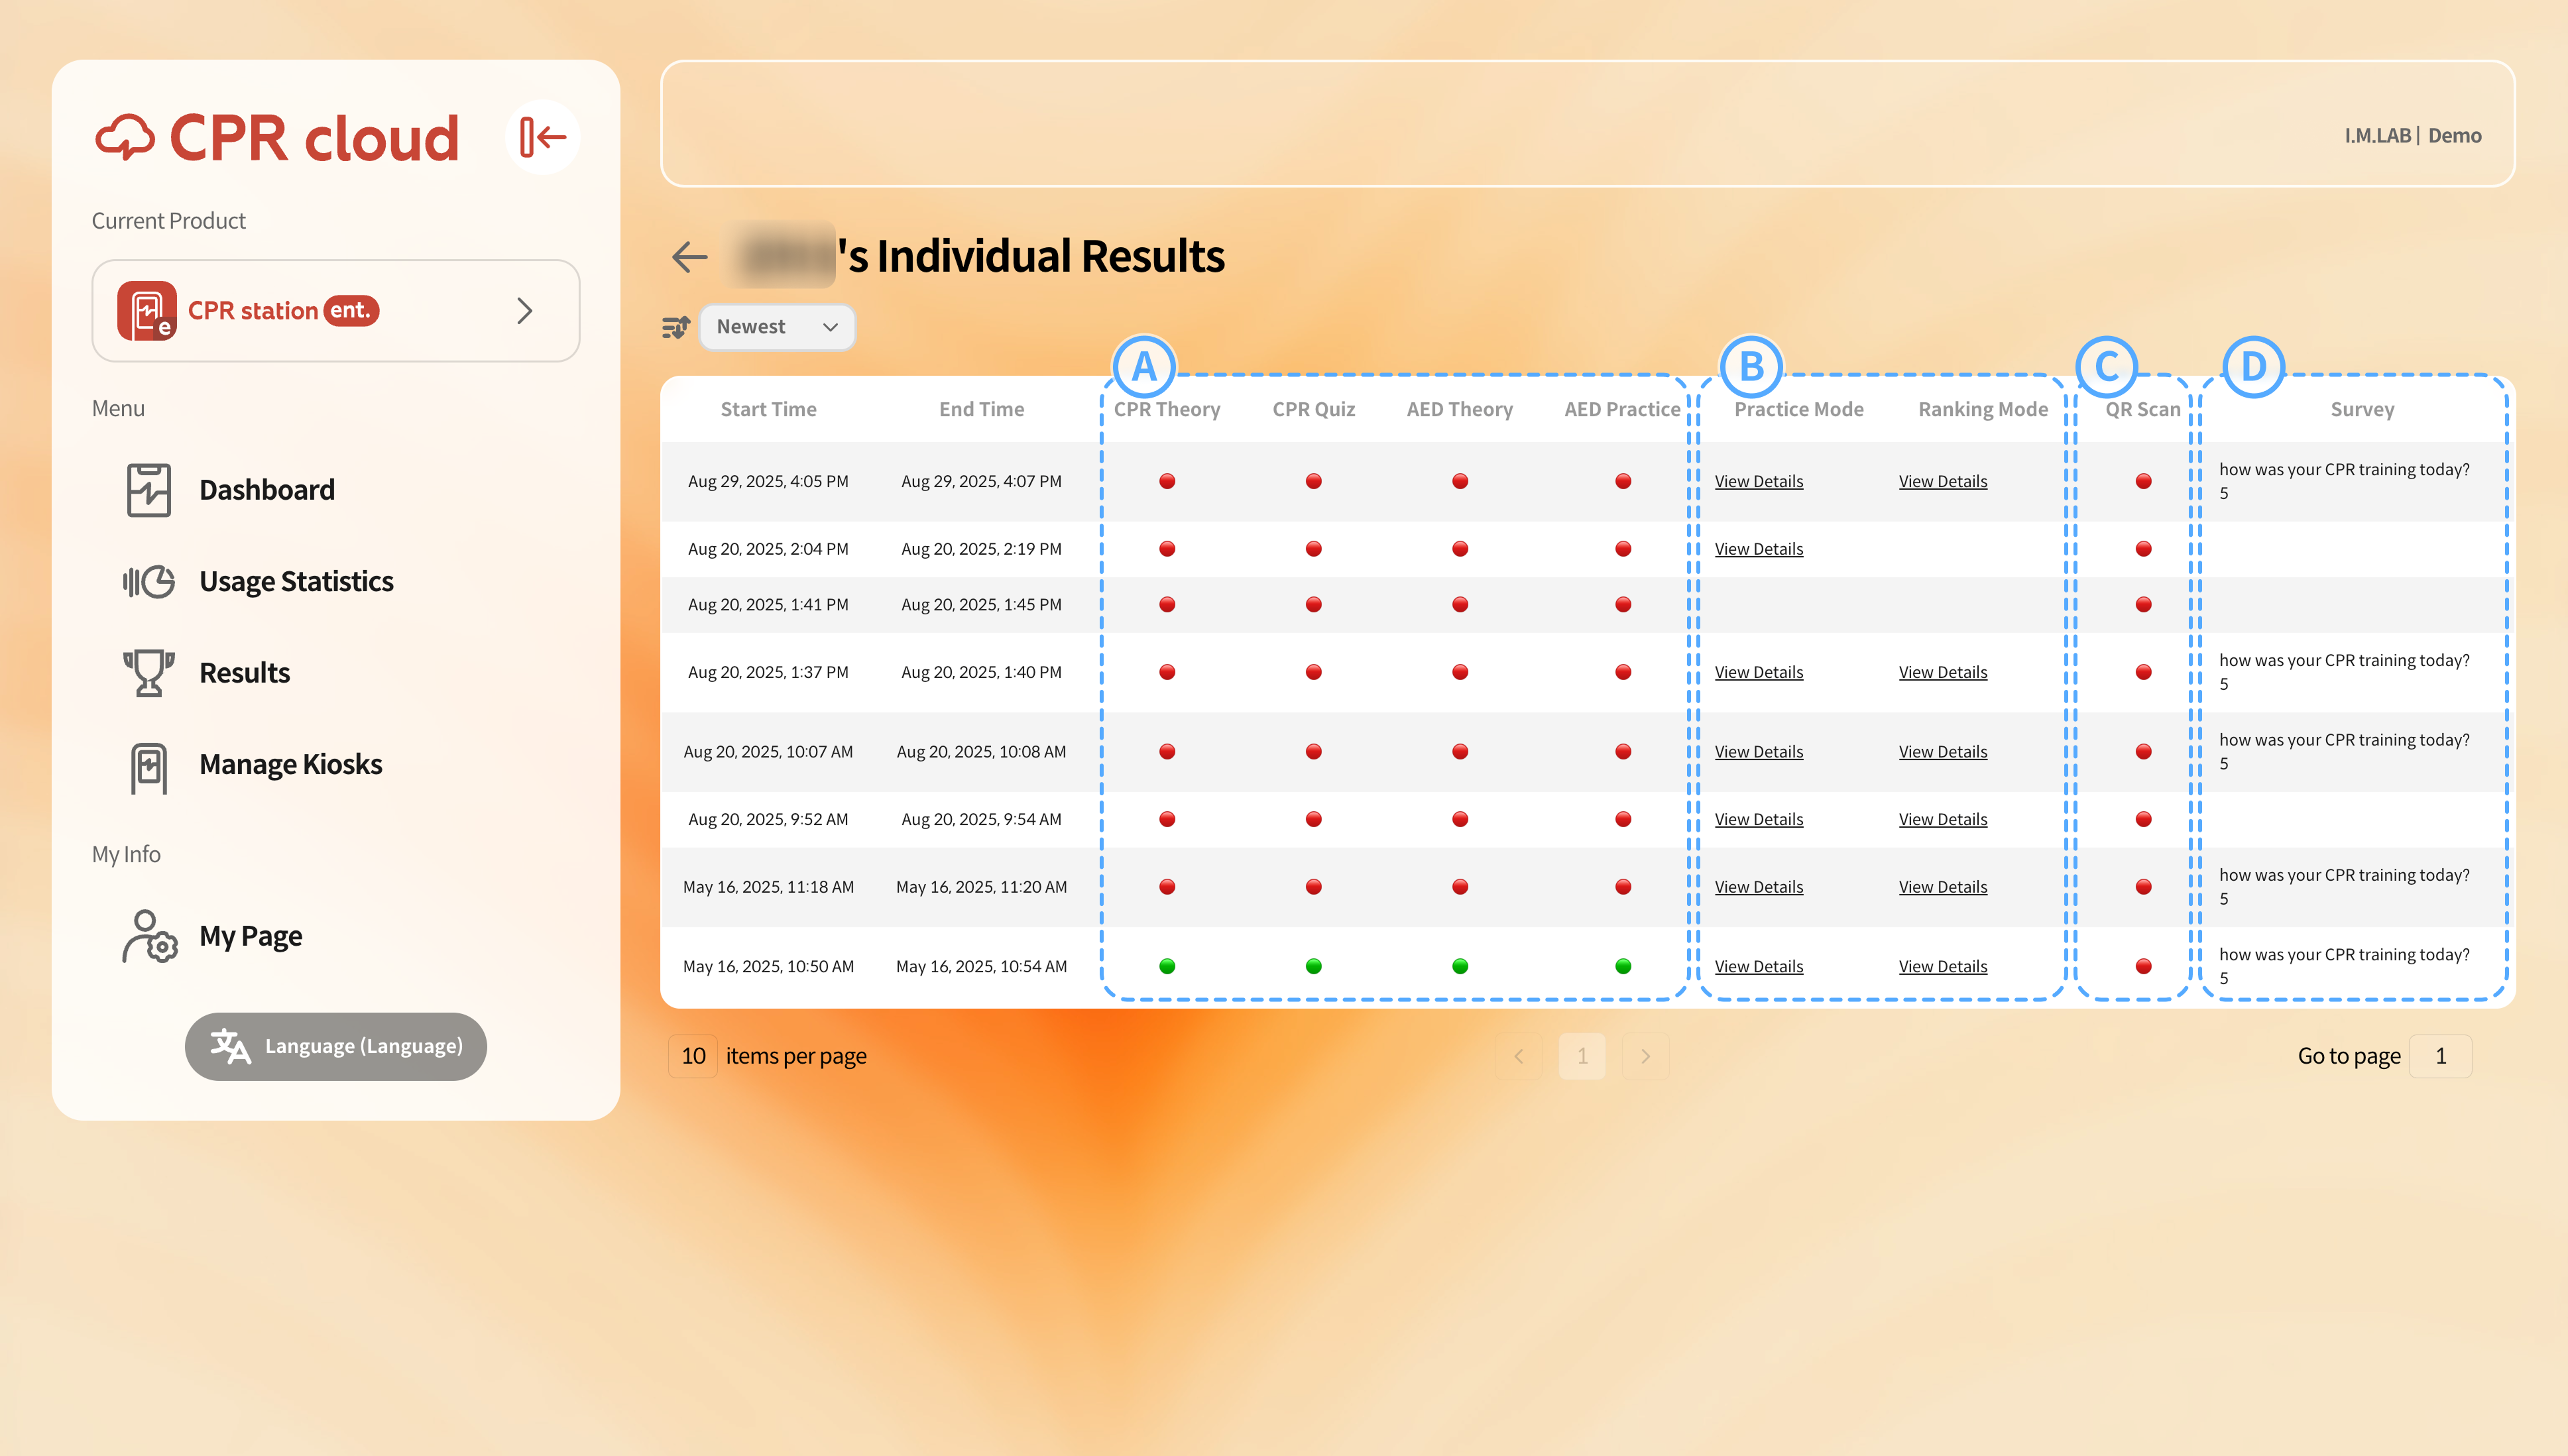
When you select View Results, you can see all CPR Station activity records for that individual at a glance.
Displays whether each learning module has been completed. Green indicates completion, while red indicates incomplete. When evaluating completion for a specific ID, if the user has completed the module even once, it is considered completed regardless of the time.
You can check the results of both Practice Mode and Ranking Mode. Incomplete modes are shown as blank cells. If a user has attempted multiple times, the most recent result is displayed.
Indicates whether the user scanned the certificate QR displayed on the final result screen.
Displays the user’s responses to the survey shown at the end of each session.
4.4. Kiosk Management
CPR Station provides various management tools for remotely managing CPR devices.
- In Kiosk Status, administrators can monitor the real-time status of their kiosks, including online/offline status, manikin connection, version, and update information.
- By issuing a Share Code to assistant managers, you can delegate monitoring and management tasks for selected kiosks.
- With Standby Screen Settings, you can upload videos or images to display when the kiosk is not in use, and assign specific content to each device.
4.4.1. Kiosk Status
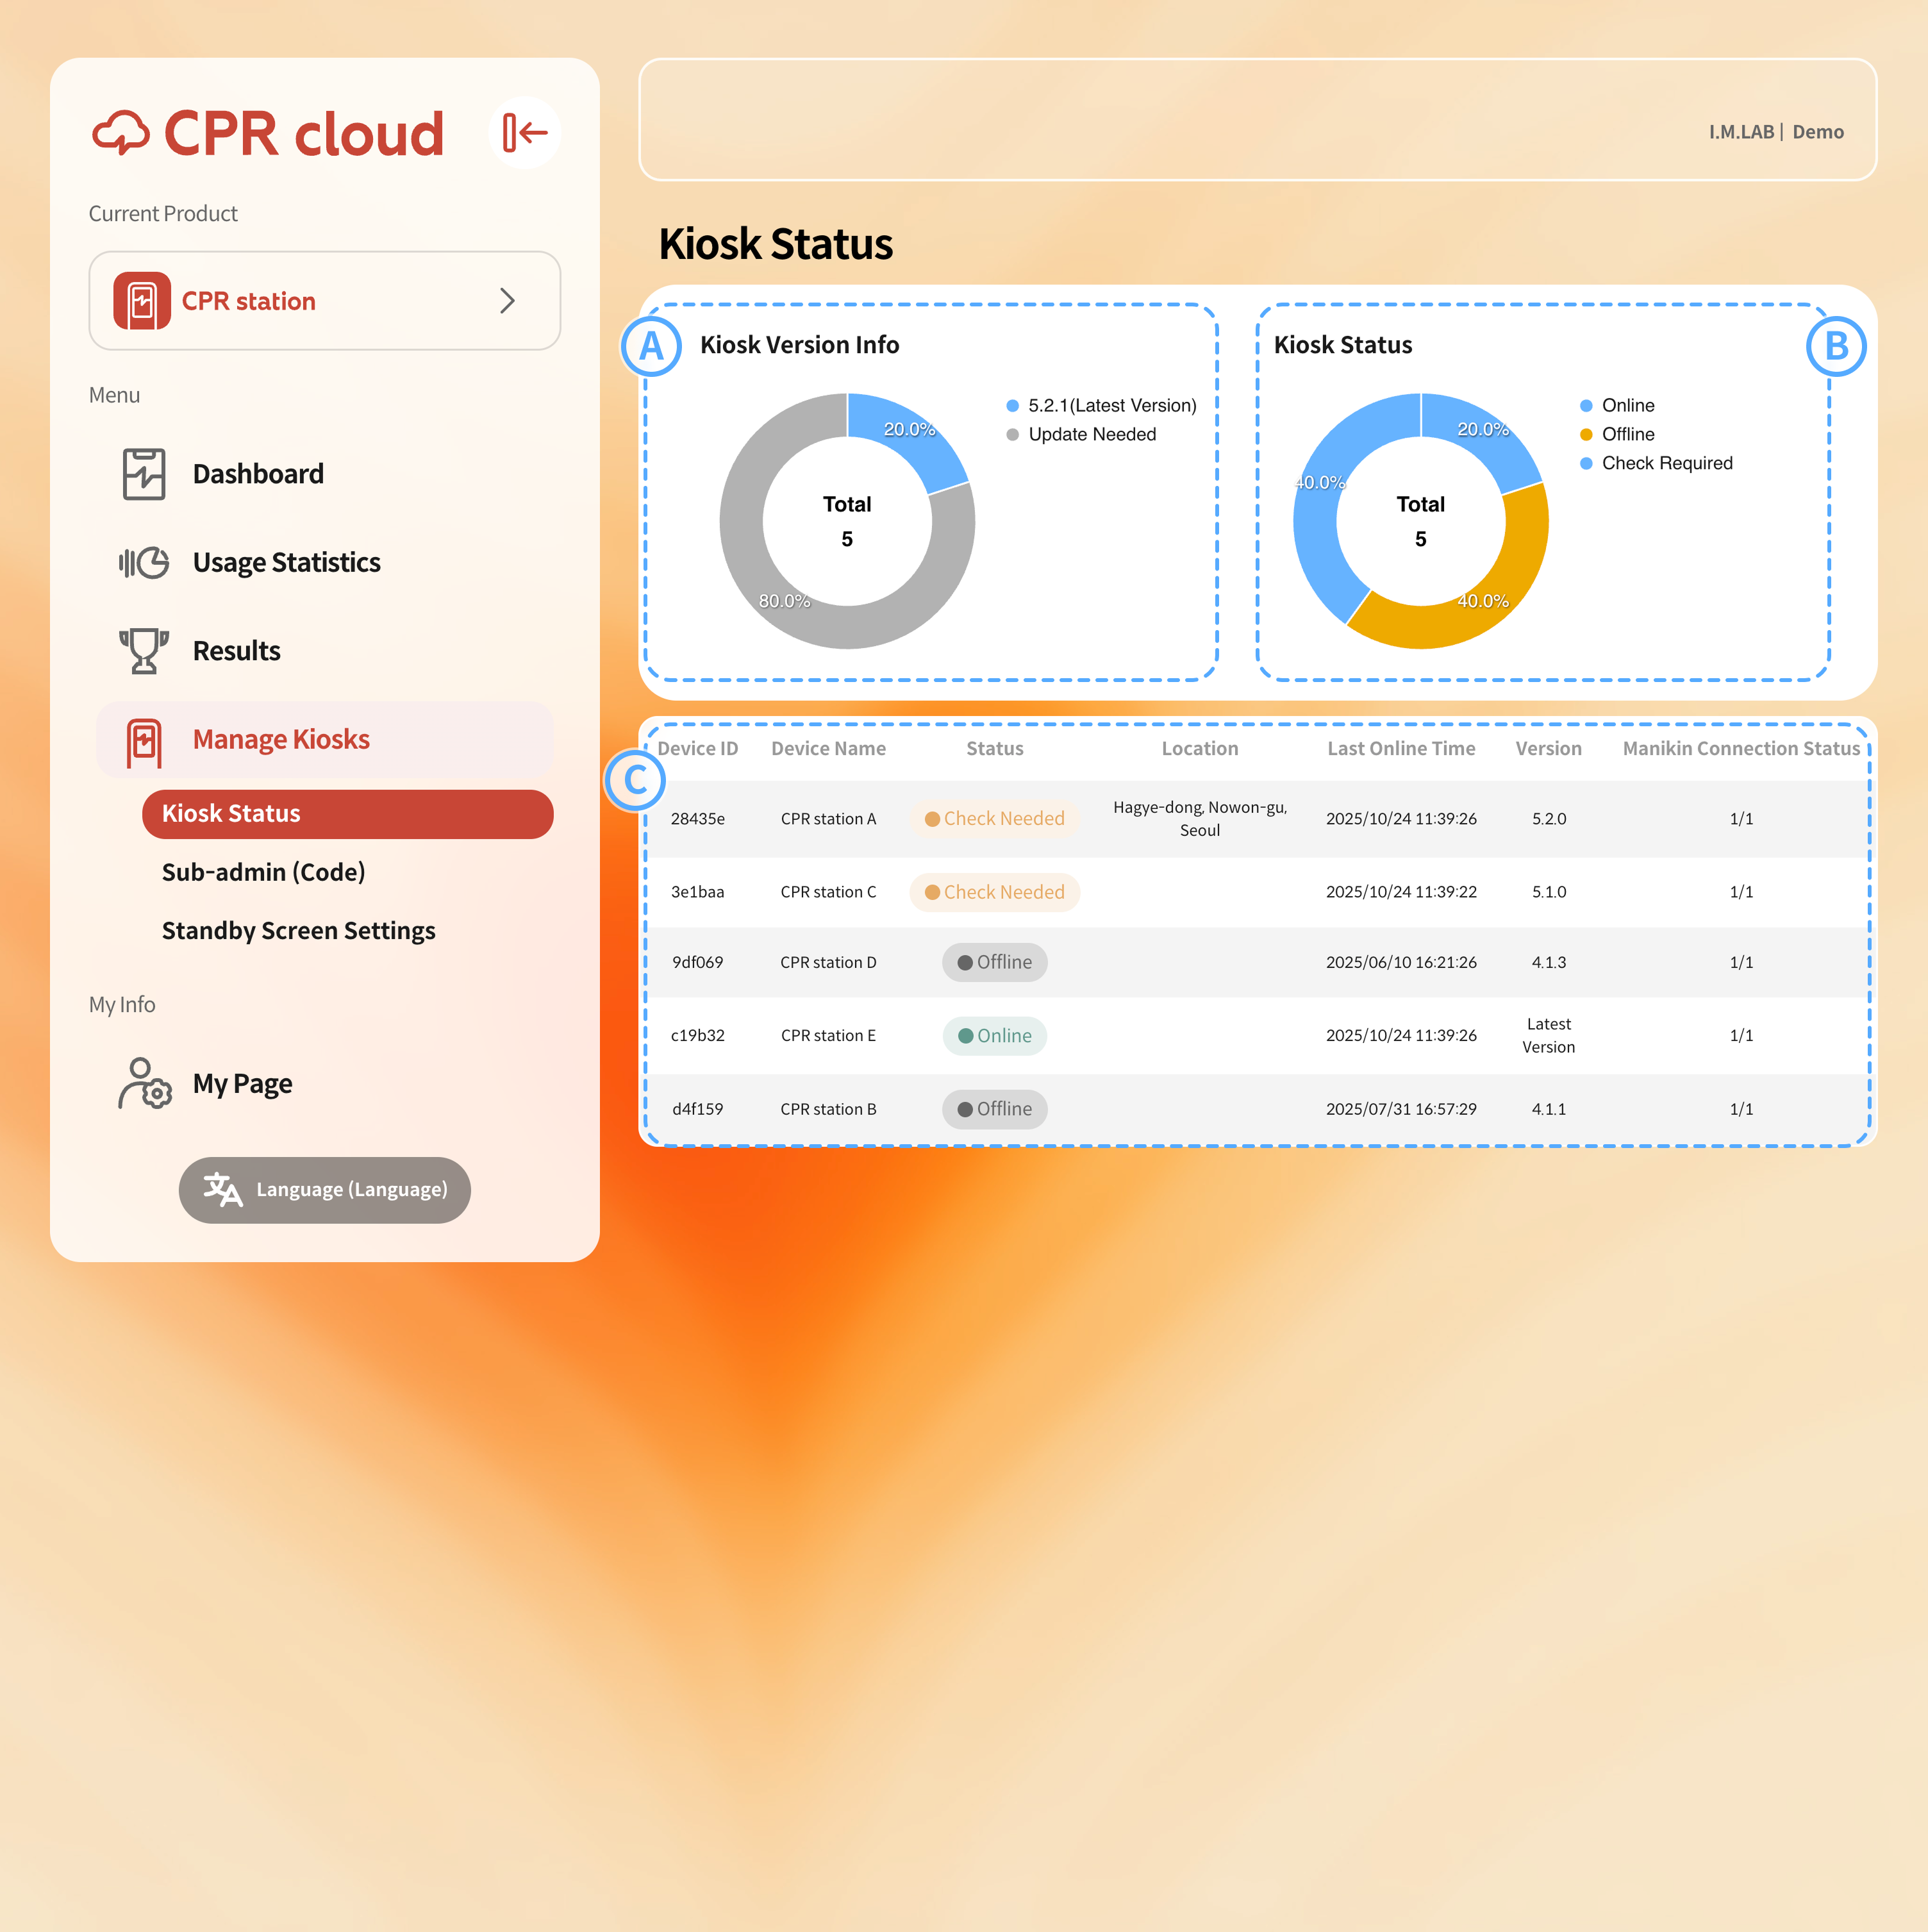
Displays the ratio of kiosks with the latest version
blueto those not updated gray.
Shows the current online/offline status and any detected issues for each device.
Allows you to check detailed status information for each device.
4.4.2. Generating and Managing Share Codes (Assistant Administrator)
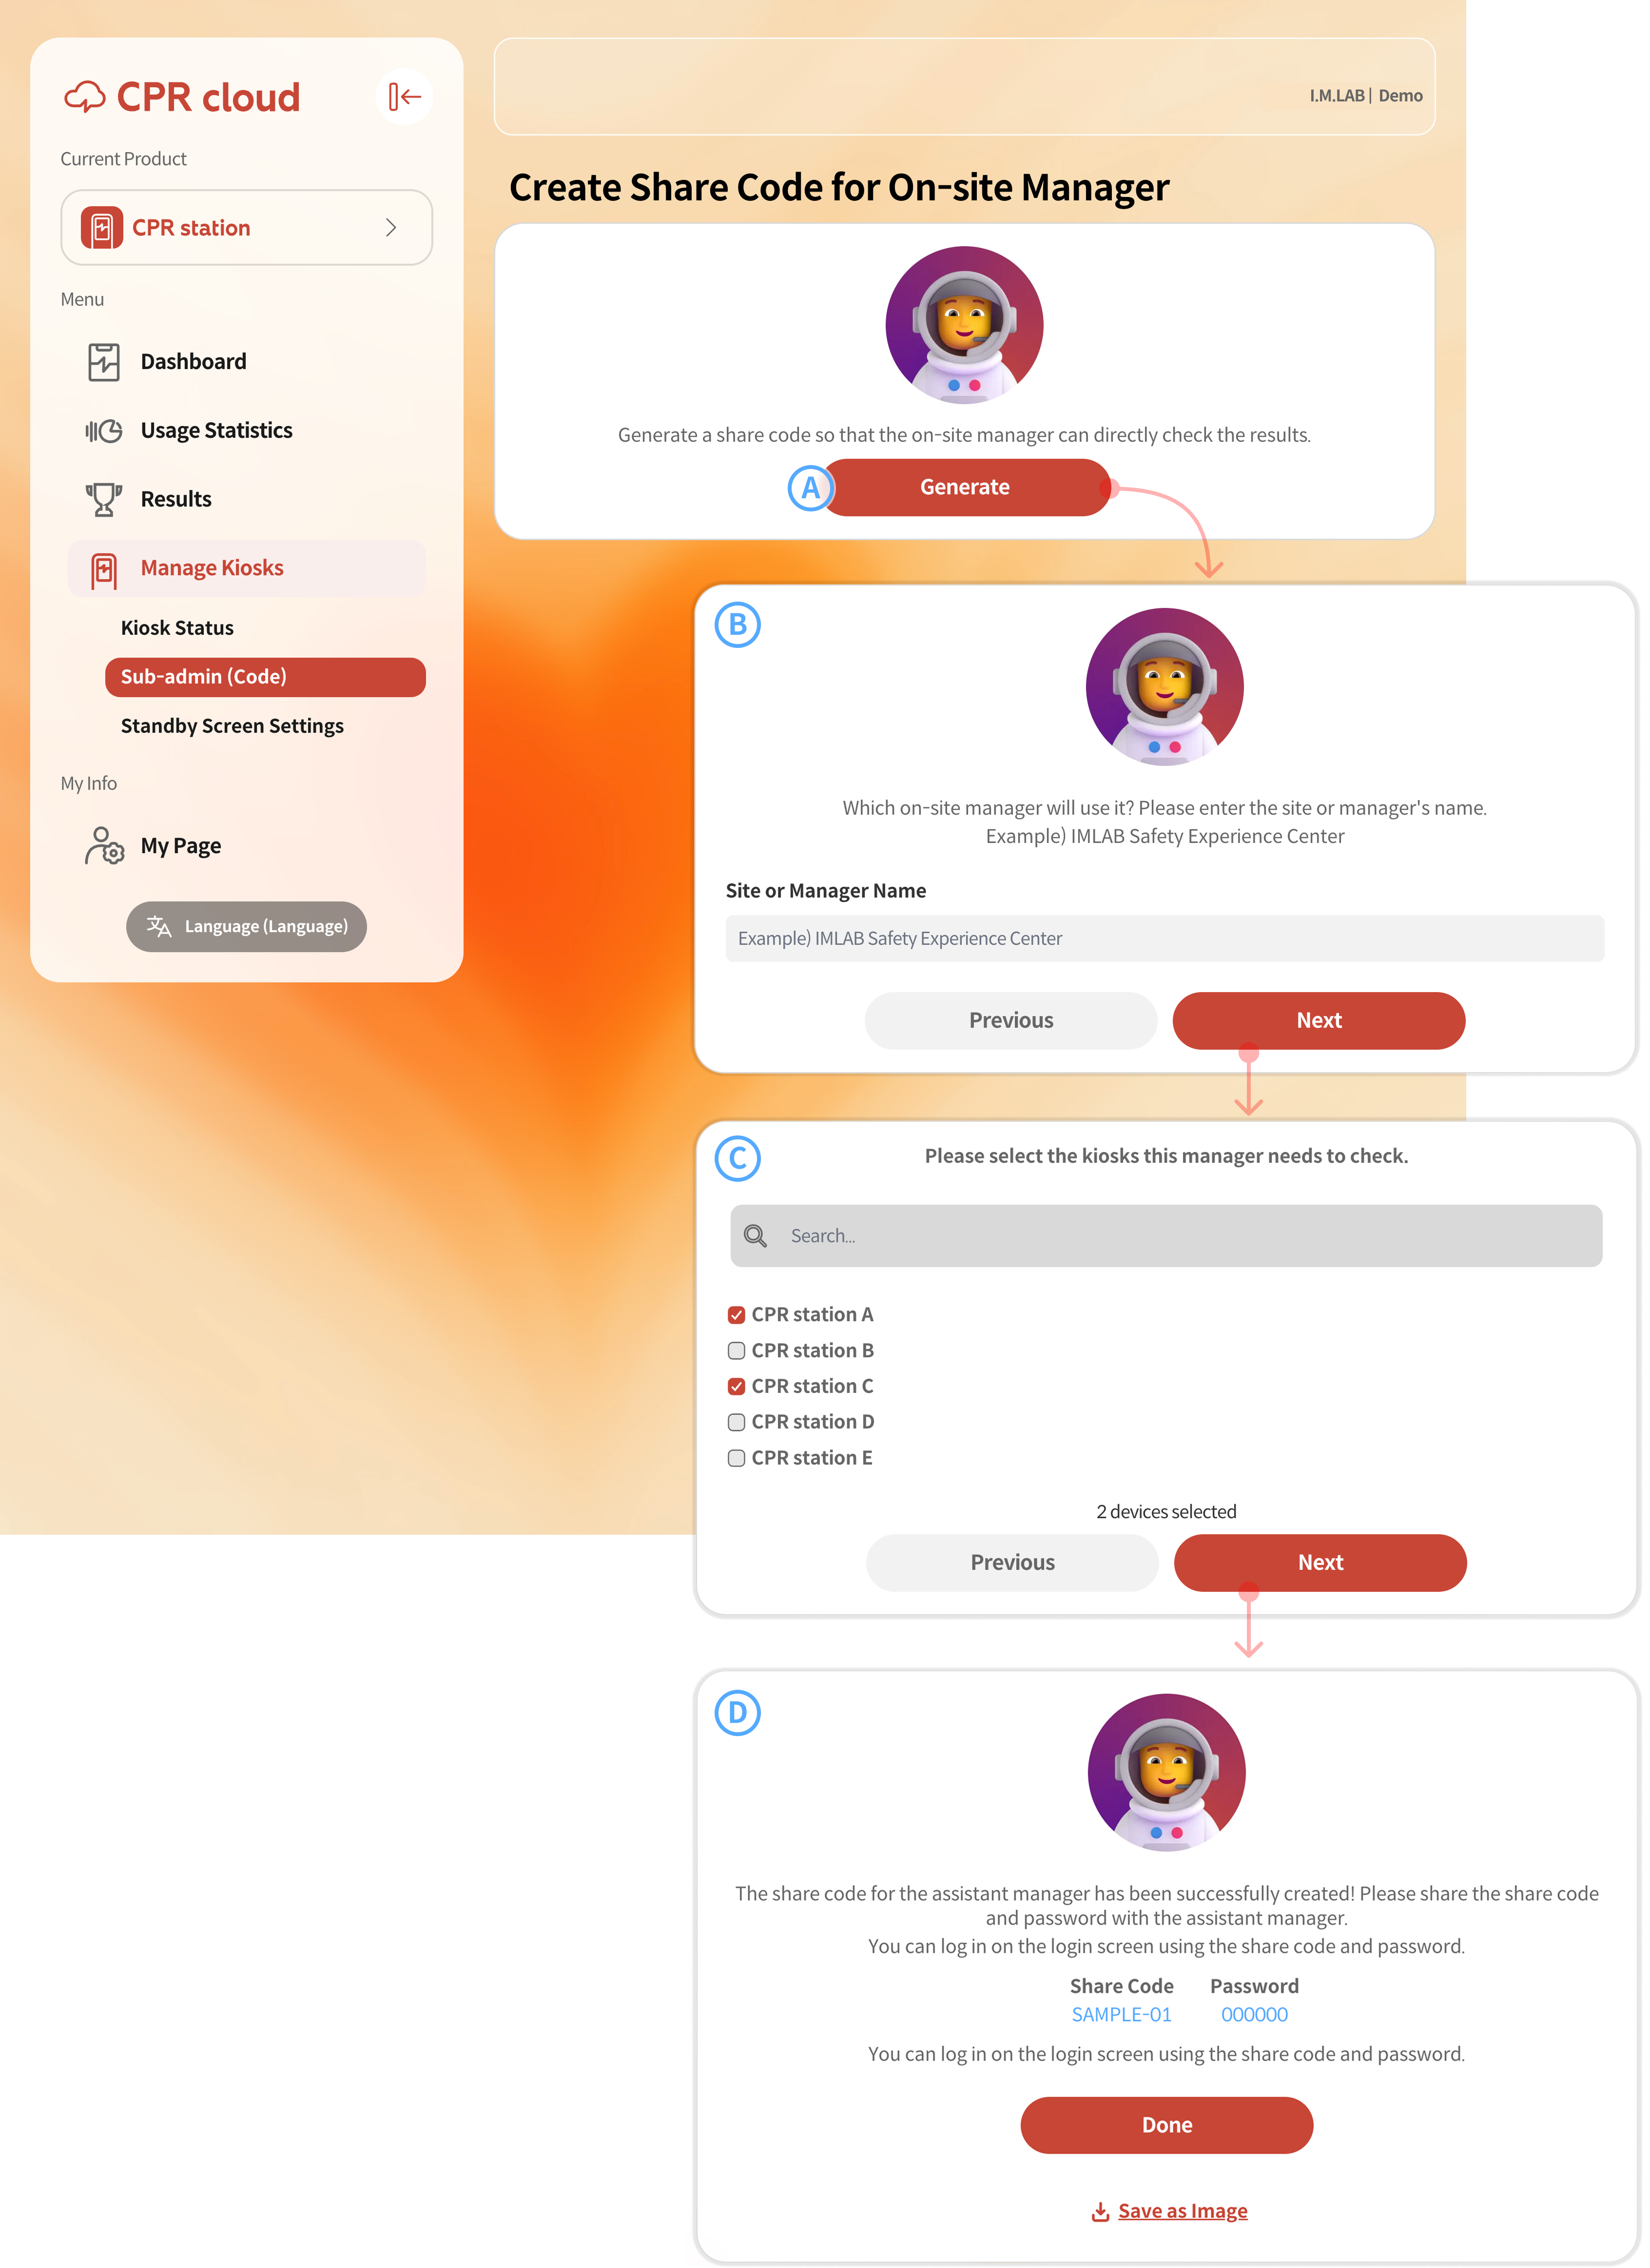
To create a share code, select the Generate button.
Enter a name for the sub-admin or sub-admin group. Use a name that clearly represents the person or group, such as a manager’s name, department, or location.
Select the devices to assign to this group. You can use the search bar to find a specific device if the list is long.
After generating the share code, record the code and password separately and share them securely with the designated sub-admin.
The share code is based on the original management code, with an extra two-digit identifier added. It can be used to log in directly from the CPR Station home screen.
When logged in with a sub-admin account, access is limited to the assigned devices, including related data, statistics, and management features. Sub-admin accounts cannot create additional share codes for other sub-admins.
4.4.3. Standby Screen Settings
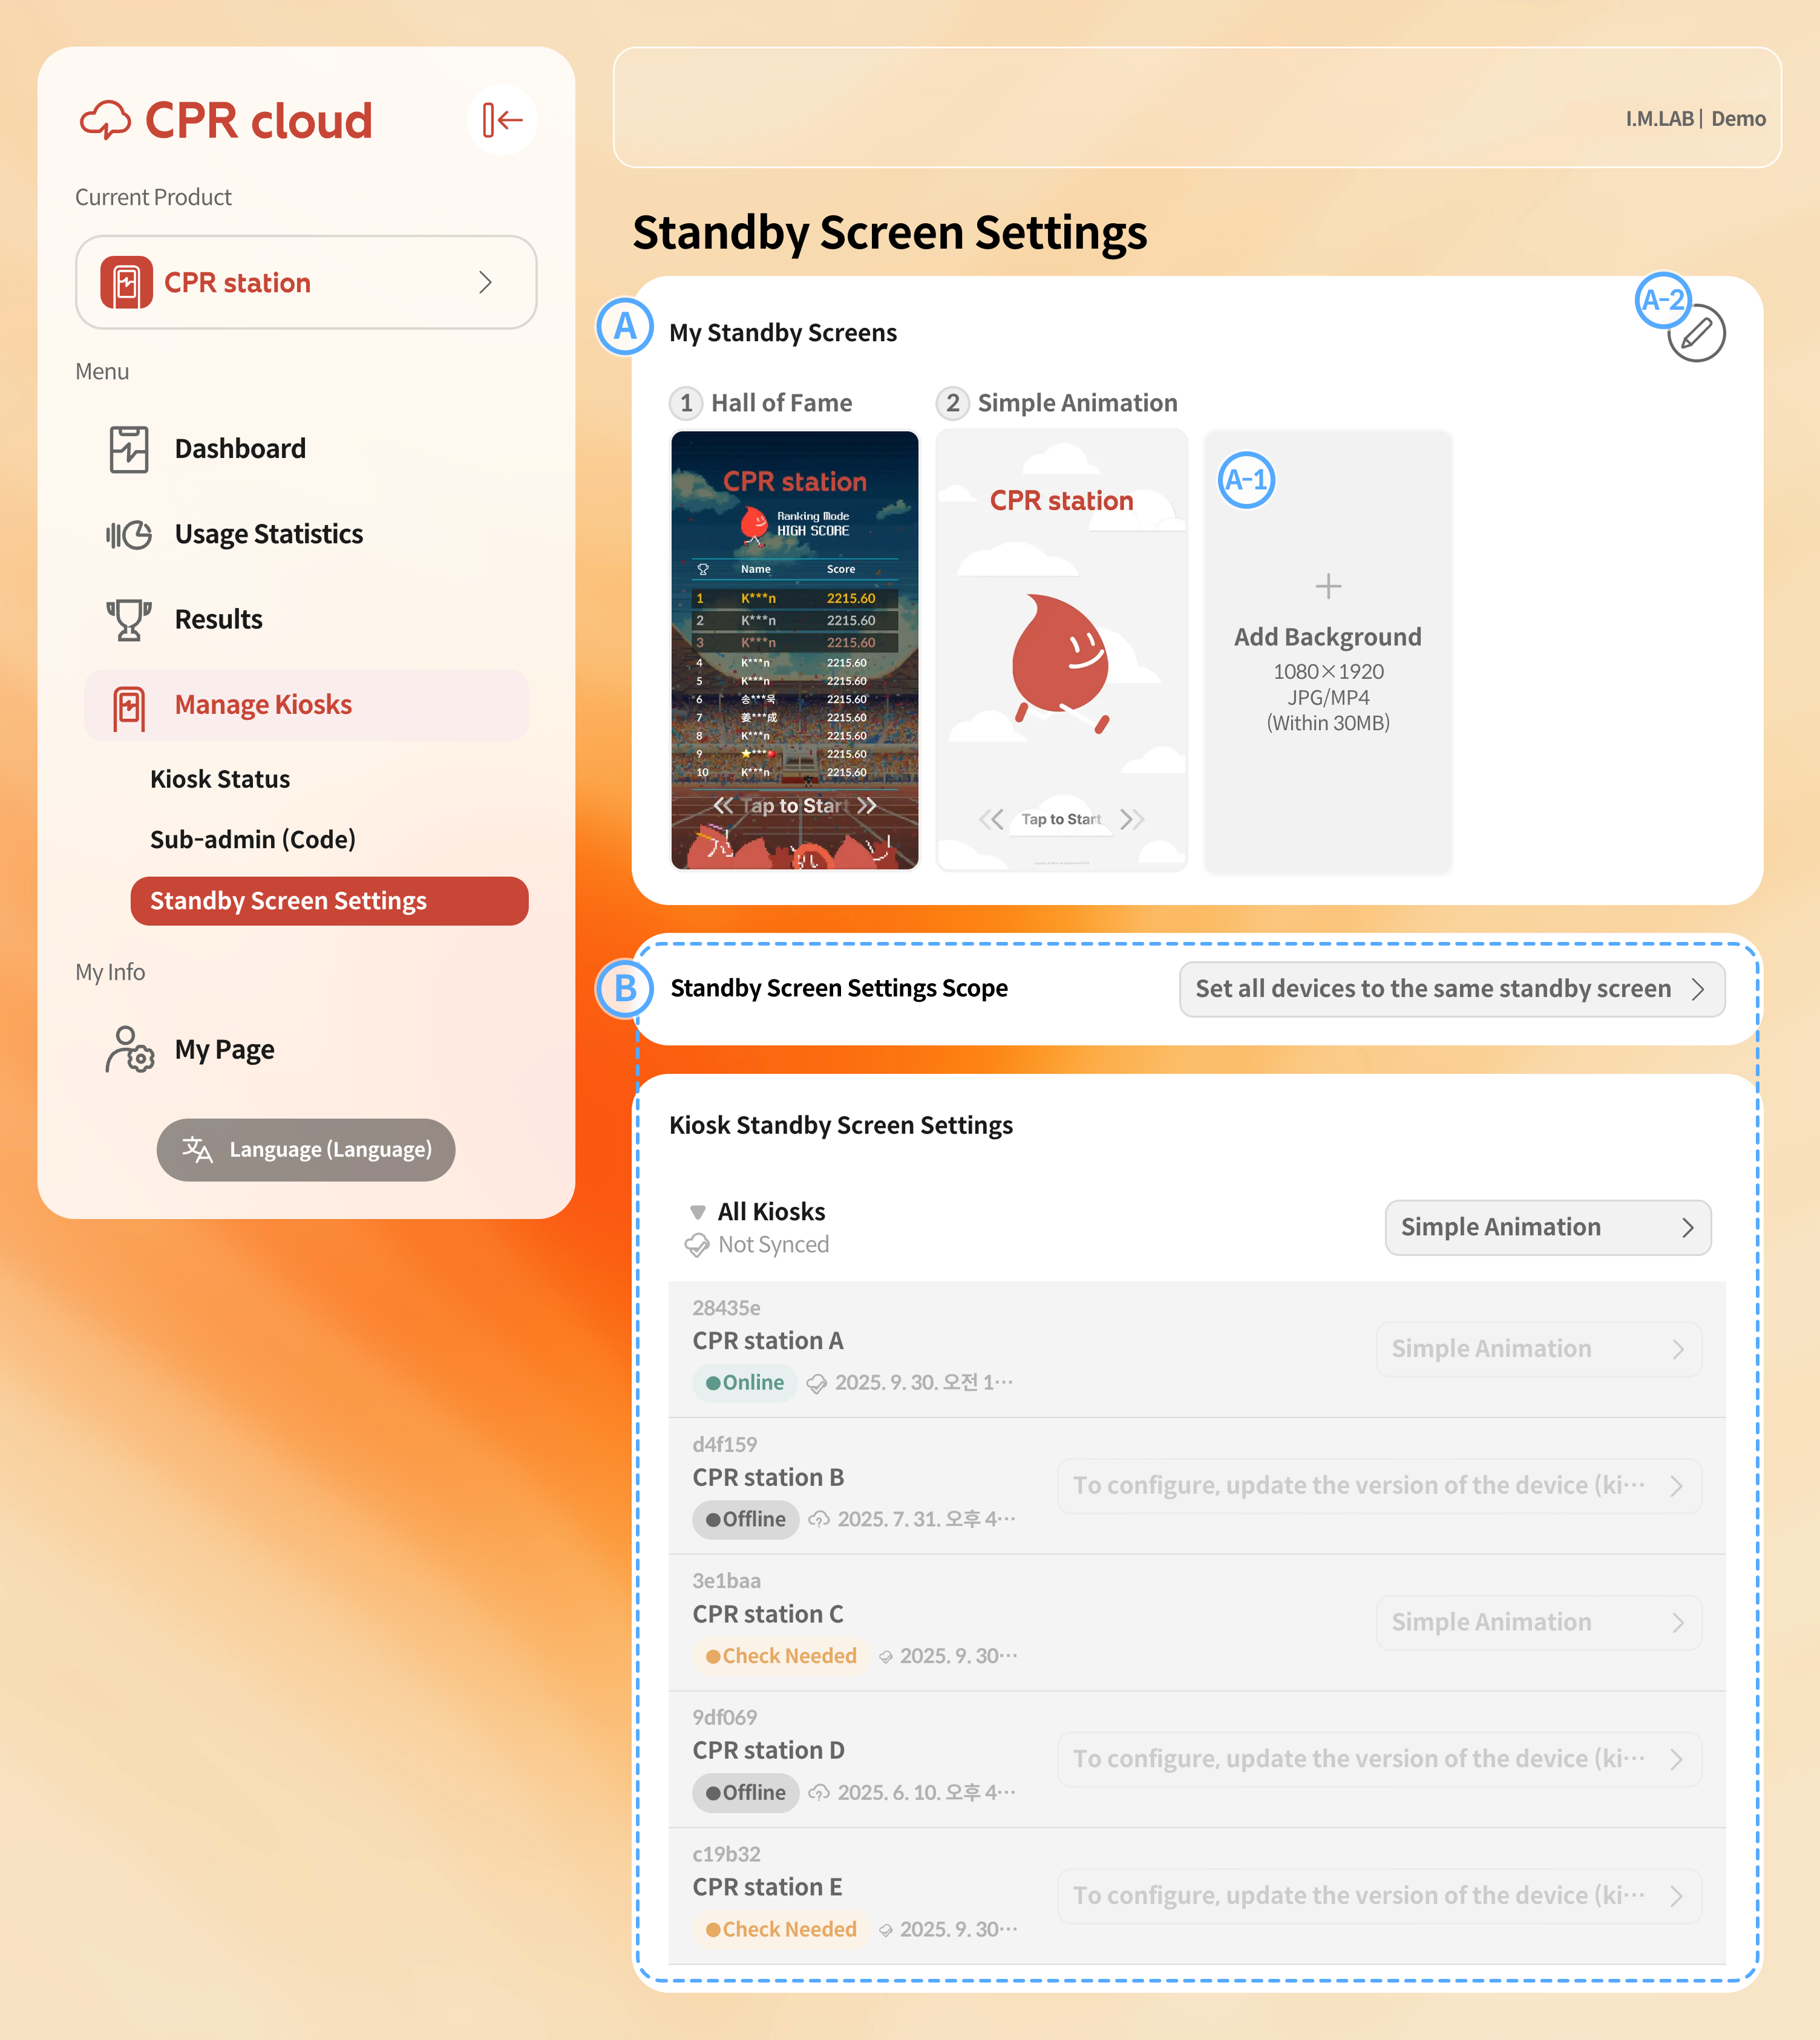
In the My Standby Screens list, you can view all available standby screen types. Two default options are provided: (1)
Hall of Fameand (2)Simple Animation.
A-1. You can add your own standby screen content. The recommended resolution is 1080×1920 (vertical). If content with a different aspect ratio is uploaded, black margins will appear. You can upload image or video files up to 100 MB each.A-2. To delete an existing standby screen, click the Edit icon (pencil symbol).
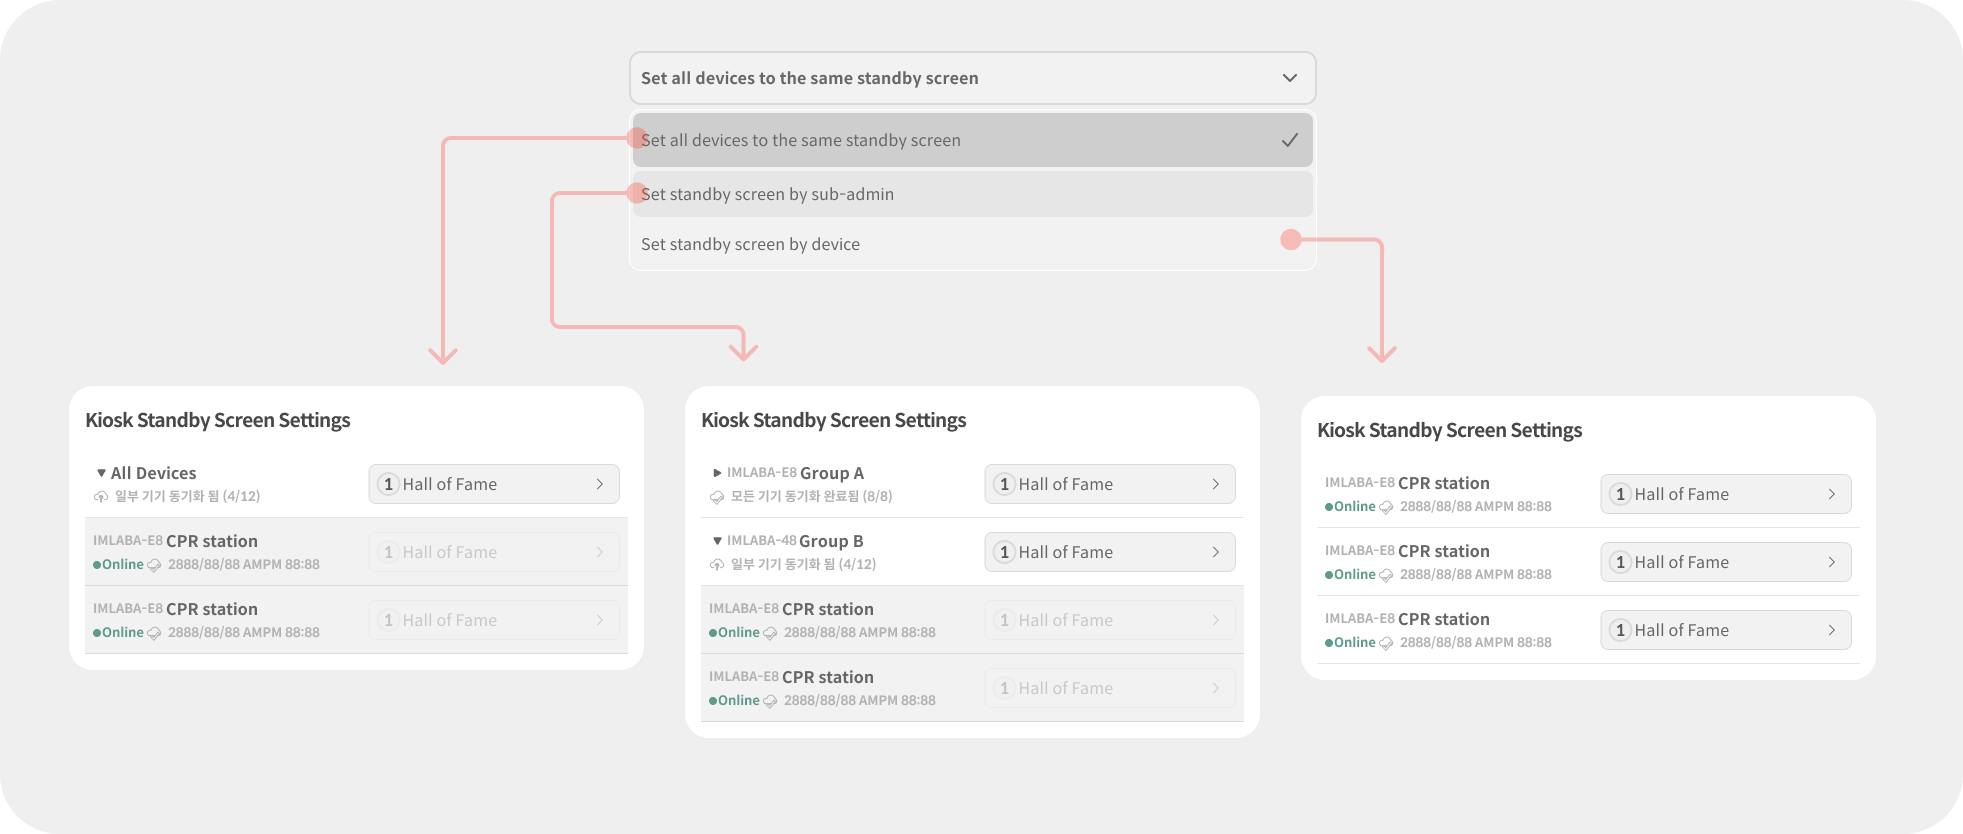
Standby Screen Setting Scope: Defines how standby screens are applied. You can set them for individual devices, by sub-admin group, or apply one screen to all devices at once.
Kiosk Standby Screen Configuration: The configuration panel changes according to the selected scope. When setting by group, click the arrow at the front of the list to view which devices will be affected.
4.5. My Page
The My Page menu is used to manage settings that apply commonly to all products and accounts associated with a management code.
4.5.1. Administrator Information
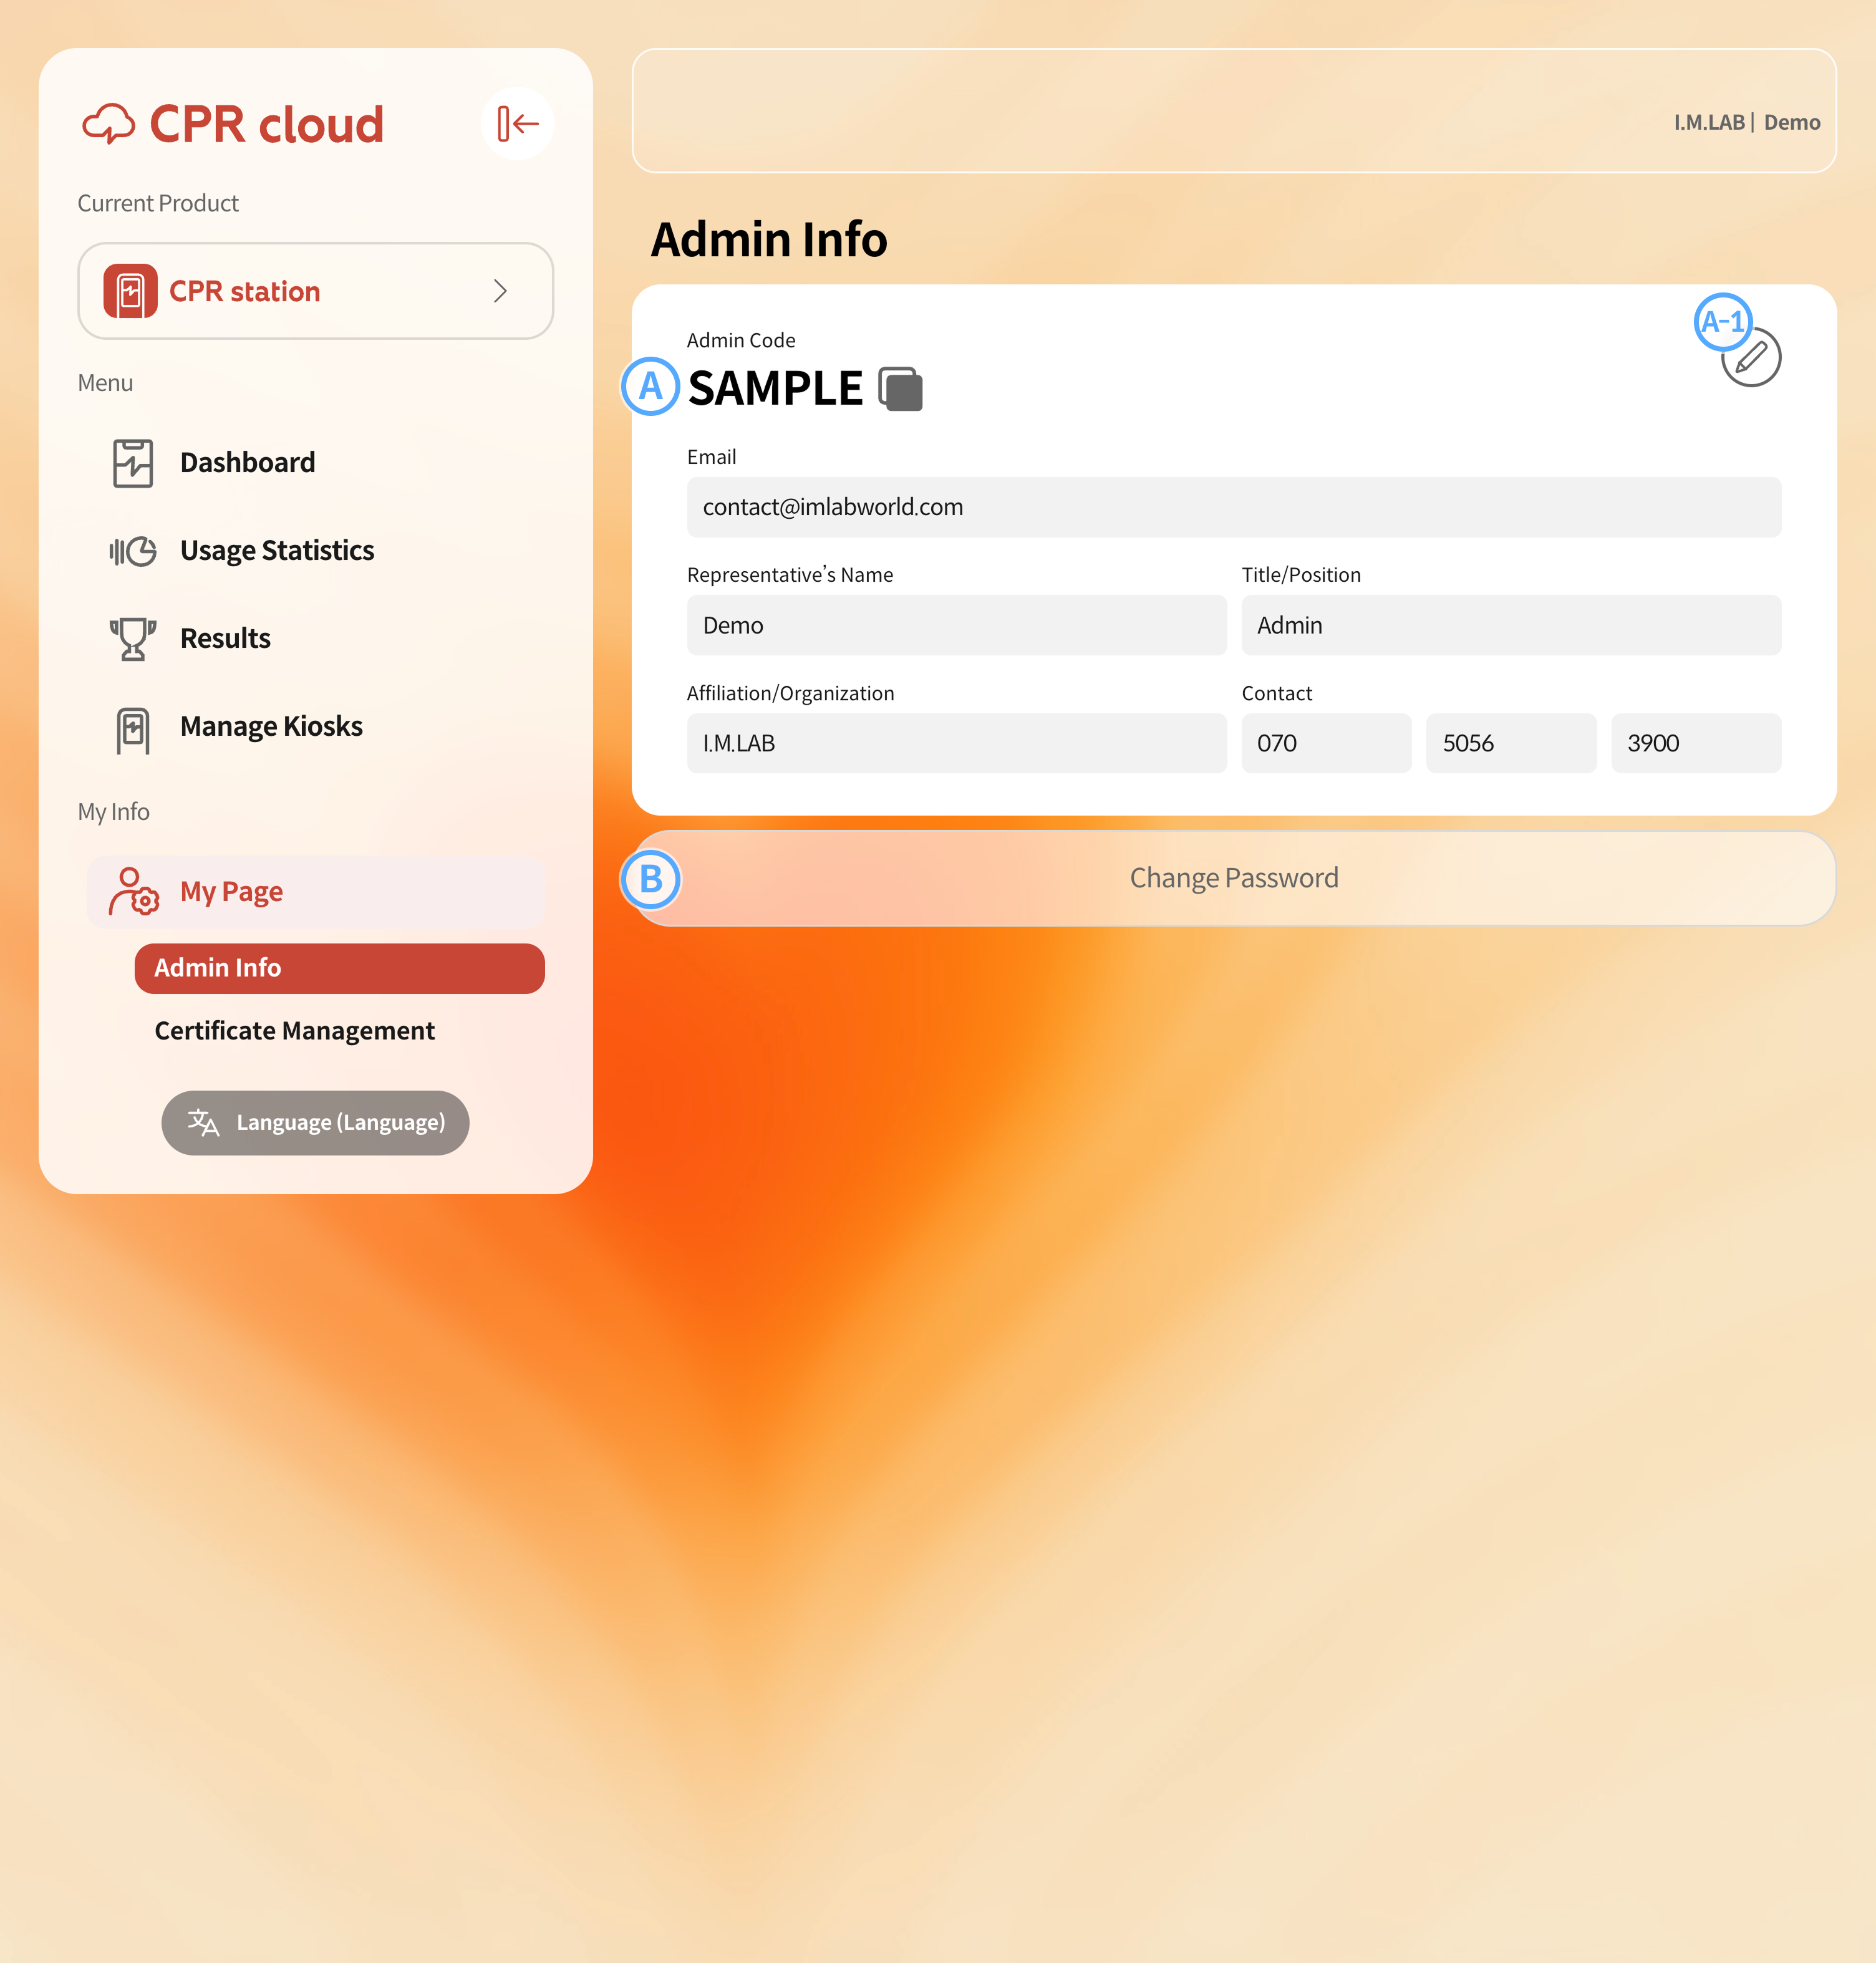
When you enter administrator information for a management code, management alerts will be sent to the specified contact.
A-1. To edit administrator details, click the Edit button and update the information.
You can change your password by clicking the Change Password button.
4.5.2. Certificate Management
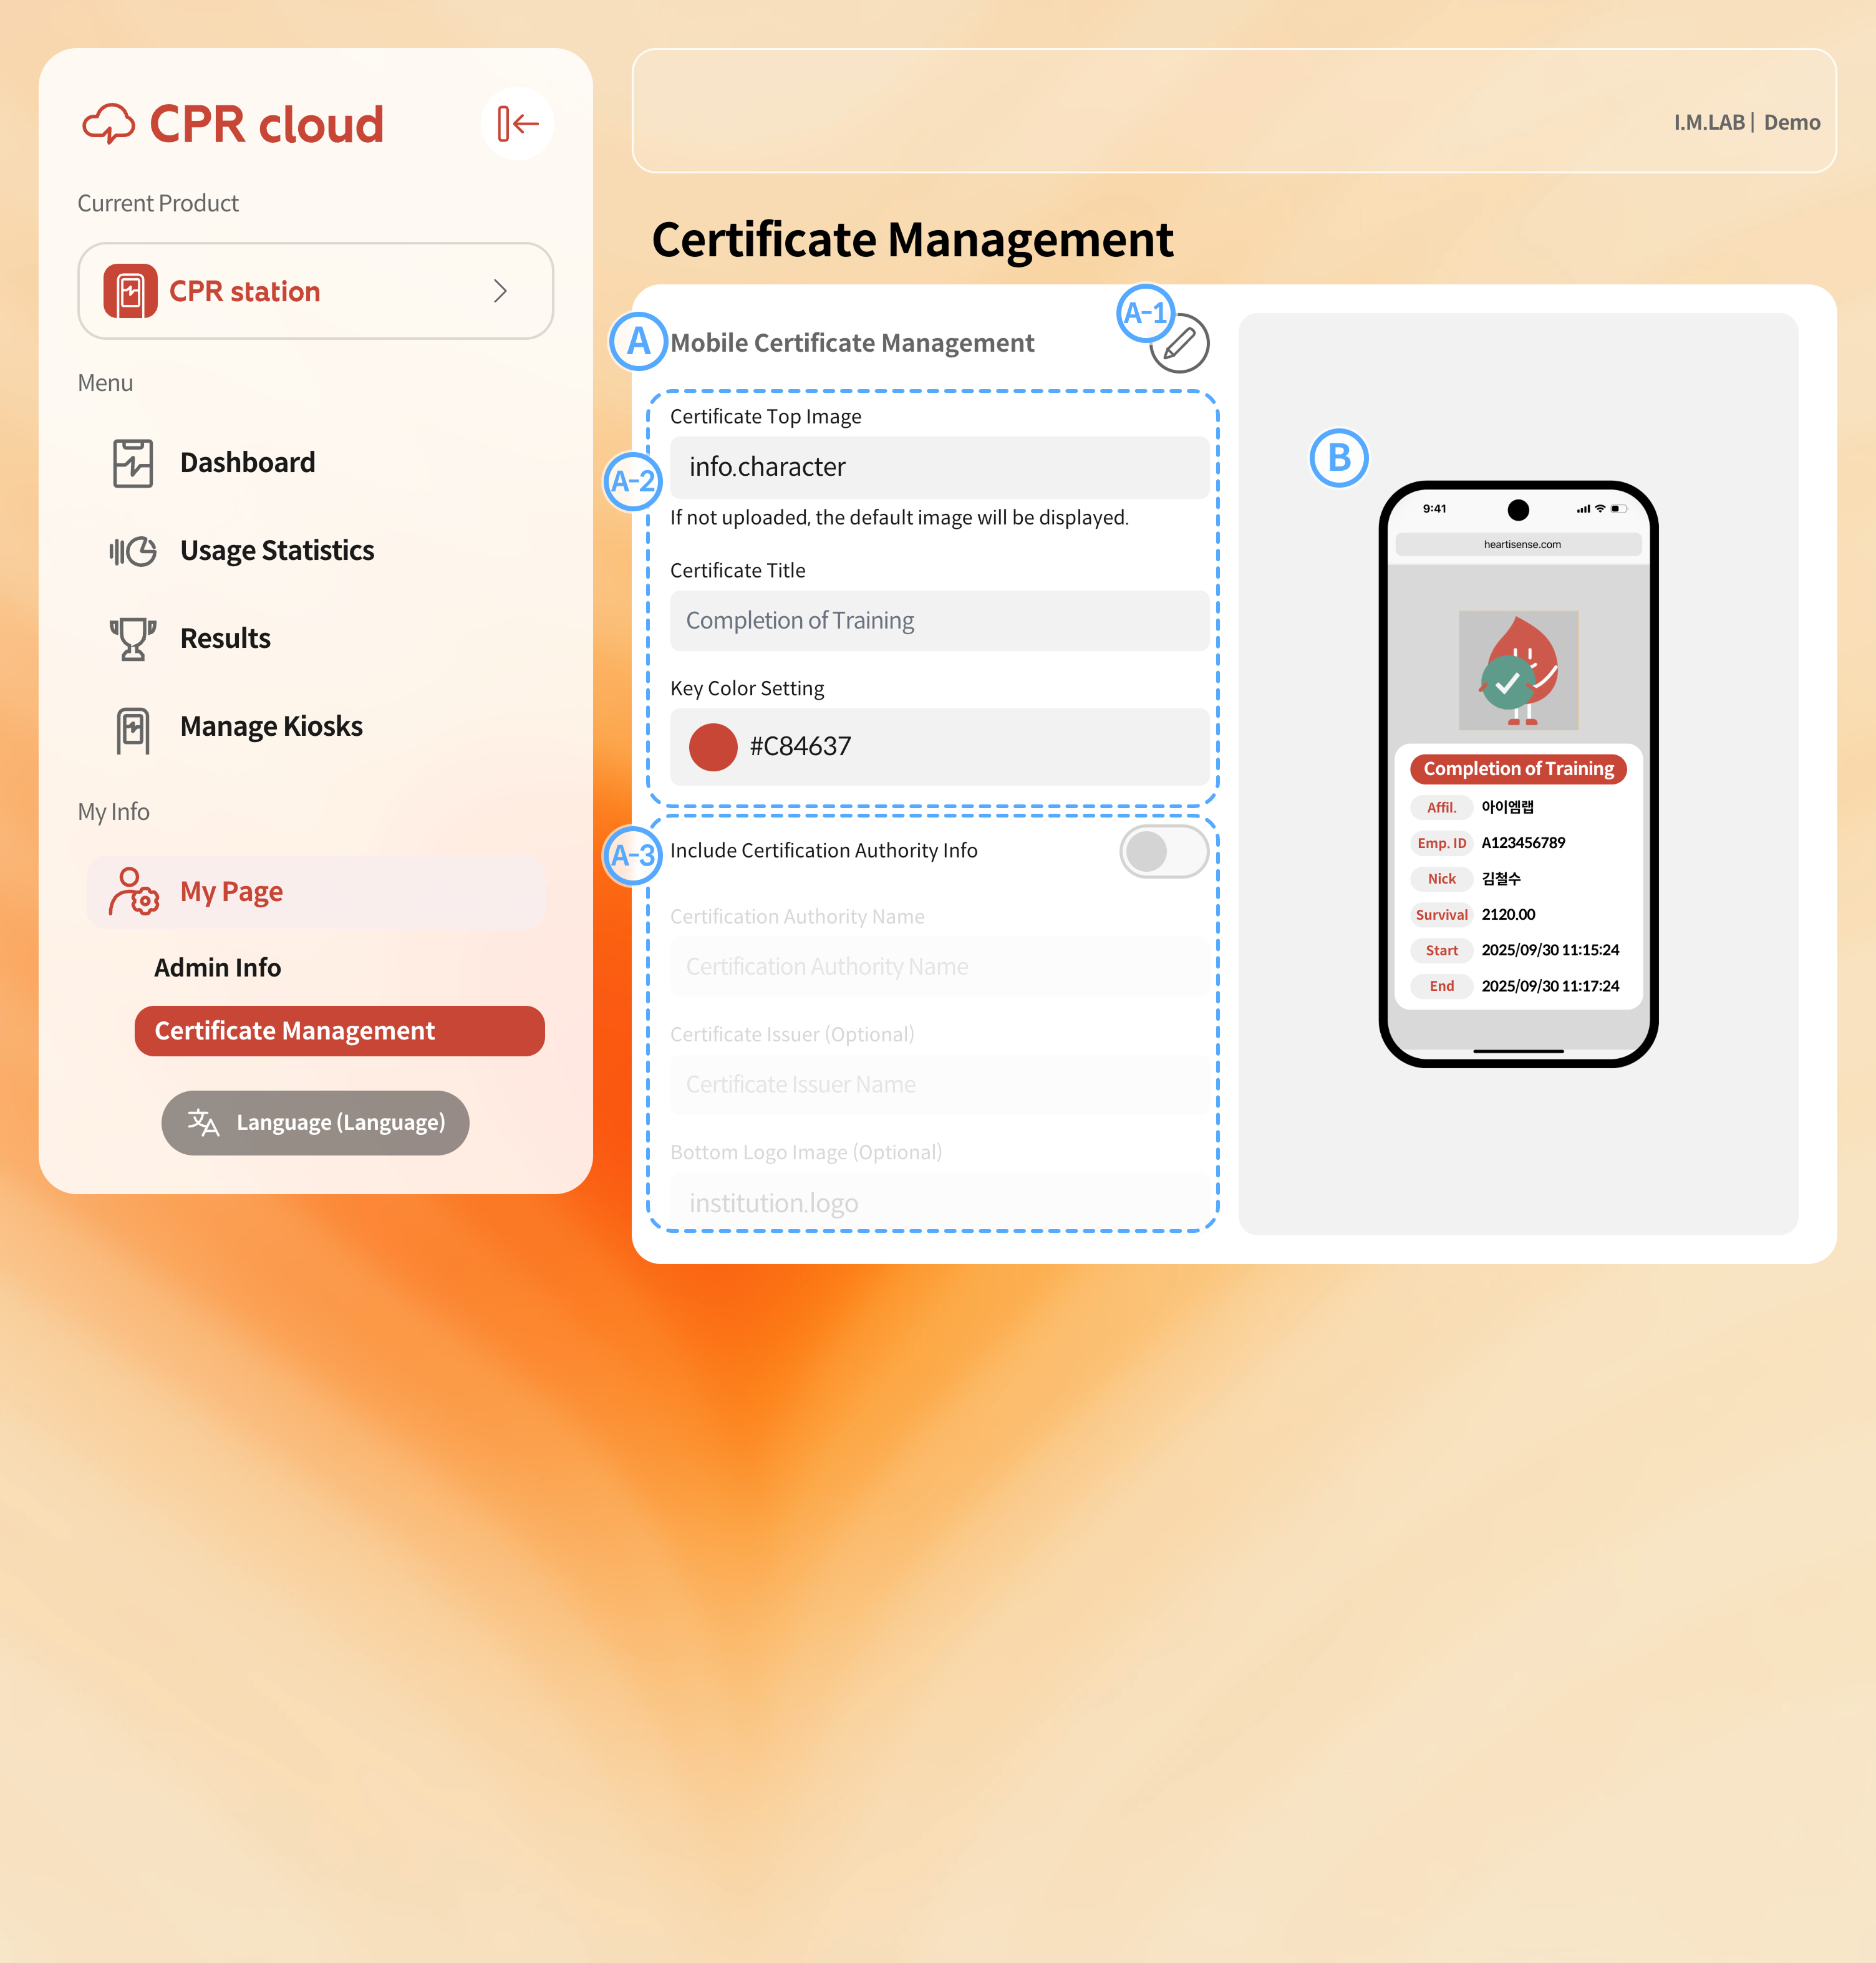
Mobile Certificate Management
A-1. To edit the layout or content of the certificate, click the Edit button first.A-2. The image, title, and key color at the top of the certificate are required fields. If not set, default options will be used.
A-3. To display the affiliated organization, enable the toggle and fill in the information. You can also attach the organization’s logo image.
A preview of the configured mobile certificate is displayed.
The certificate format configured in Certificate Management will appear when scanning the certificate QR code on an Enterprise model device.
You may also be interested in…
Can't find what you're looking for?
Please contact us at contact@imlabworld.com with your affiliation, name, and inquiry details.